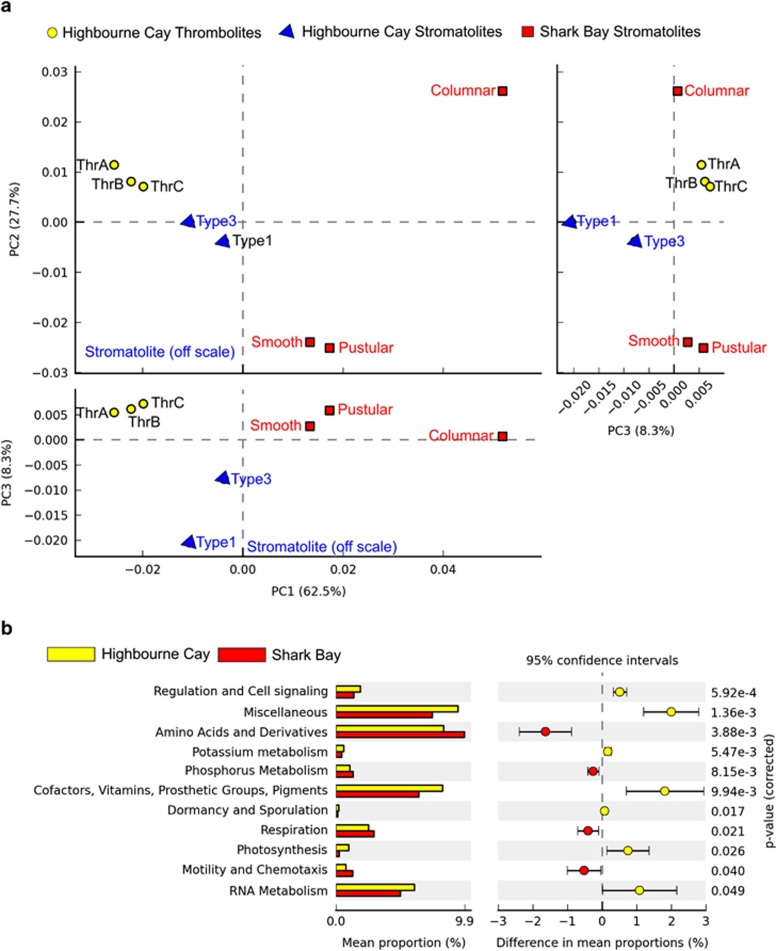
Figure 5.
Principal coordinate analyses comparison of the metabolic potential of Shark Bay and Highbourne Cay metagenomes. (a) PCA plots show the results from the STAMP ANOVA analyses. ANOVA used multiple groups and a post hoc test (Tukey-Kramer at 0.95), an effect size (Eta-squared), and a q-value (<0.05) of 11 active only features for SEED level I. A multiple-test correction using Benjamini-Hochberg FDR was employed for microbial community structure using class-level classification. (b) The chart depicts post-havoc confidence interval plots (>95%) based on ANOVA parameters including SEED level I for Highbourne Cay vs Shark Bay carried out in STAMP. Similarities and differences between Highbourne Cay and Shark Bay microbial mats are shown.

