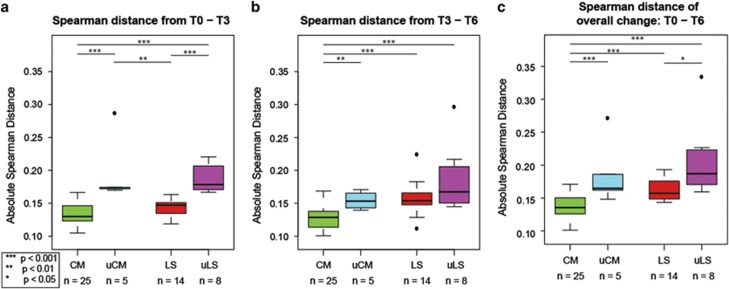
Figure 6.
Boxplots showing the absolute Spearman distance from (a) T0 to T3; (b) T3 to T6; (c) overall from T0 to T6; for subjects classified as community-dwelling (CM), long-stay-dwelling (LS) and unstable subjects from the community (uCM) and from long-stay care (uLS). Significant differences between groups were determined by analysis of variance of linear models.

