Figure 2.
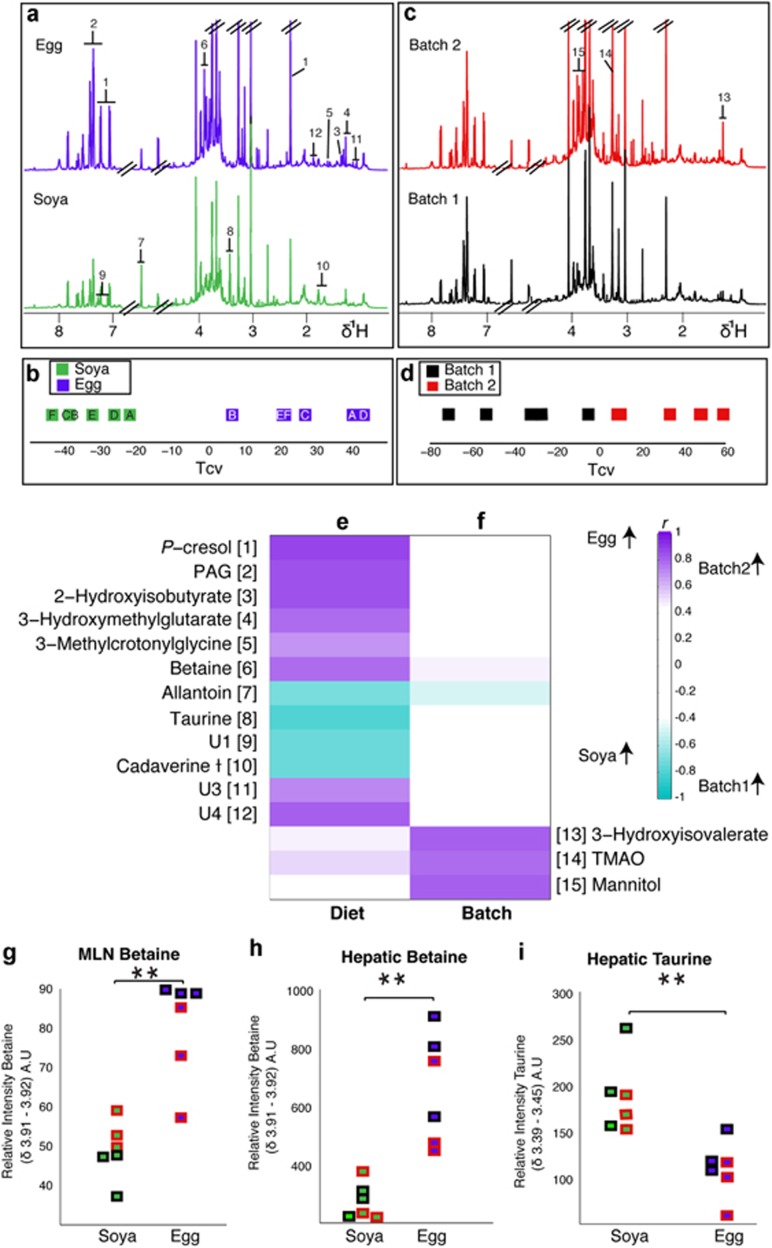
Weaning diet and early environment both affect the urinary metabolic phenotype of the young pig. Median spectra from each group fed either an egg-based (top, n=6) or soya-based (bottom, n=6) diet (a) with numbers corresponding to the listed metabolites (e) and (f). The groups underwent comparison by pairwise O-PLS-DA analysis conducted with one predictive and one orthogonal component (Q2Y: 0.81, R2Y: 0.97, R2X: 0.54) and the cross-validated scores (Tcv) are shown (b), each point represents one animal and the letters correspond to litter. Discriminating metabolites are shown in (e). (c) Represents median spectra from each experimental batch with numbers corresponding to the listed metabolites in (e) and (f). The Tcv from an O-PLS-DA model constructed with one predictive and one orthogonal component (Q2Y: 0.72, R2Y: 0.92, R2X: 0.50) are shown in (d). The discriminatory metabolites from this model are highlighted in (f). Plots of integral regions calculated from 600 MHz HR-MAS-NMR spectra of tissues from each animal; (g) relative betaine concentration in the MLN, where the points on the left represent the animals on the soya diet and those on the right the egg diet. Animals in batch 1 are outlined in black, whereas those in batch 2 are outlined in red. Integral regions of hepatic betaine (h) and hepatic taurine (i). ** denotes P<0.001 (Wilcoxon rank sum).

