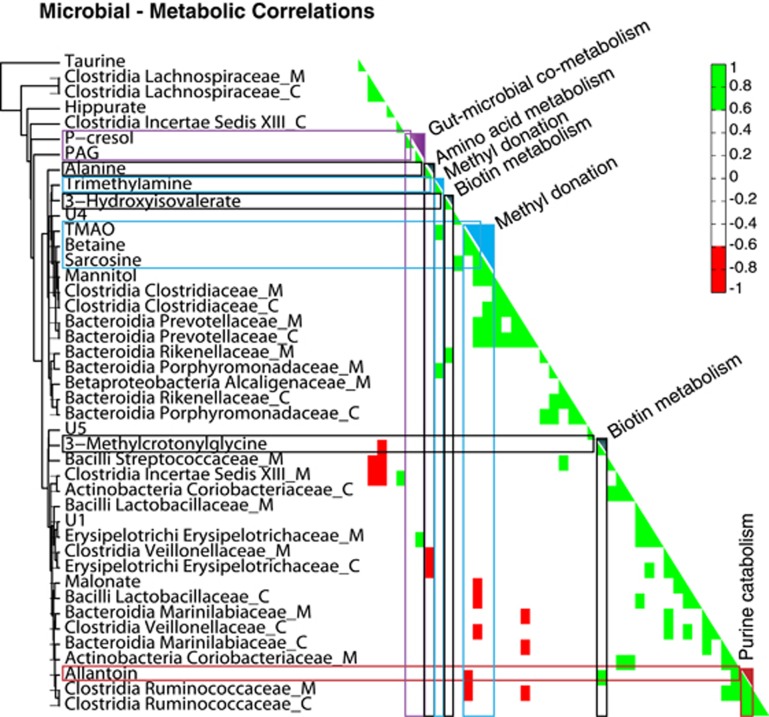
Figure 4.
Microbial-metabolic interactions are visible across multiple metabolic pathways. A hierarchical clustering and correlation map between bacterial families and selected metabolic integrals. Positive correlations are shown in green and negative correlations in red. Gut microbial metabolites are highlighted in purple, metabolites related to methyl donation in blue, metabolites related to biotin in grey and those related to purine metabolism in red. The suffix ‘_C' denotes bacteria isolated from the colonic content and the suffix ‘_M' denotes those isolated from the colonic.

