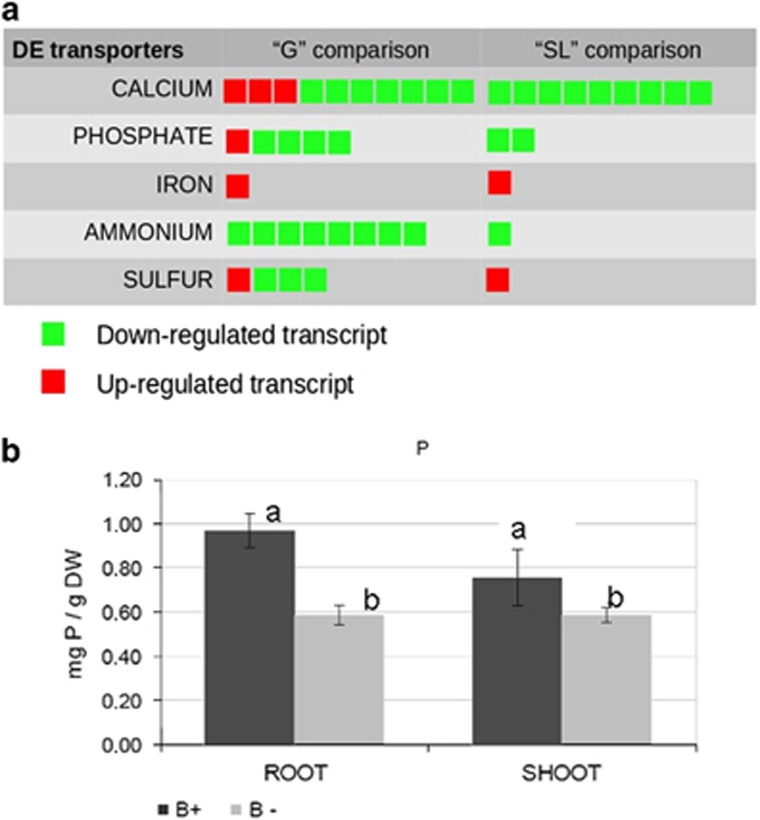
Figure 3.
(a) Graphical representation of the regulated transcripts referring to the transporter category, as identified in the comparison B+ vs B− under germinating (G) and SL-treated (SL) conditions. Each square corresponds to a regulated transcript. (b) Phosphorous mineral content in clover plants (roots and shoots) colonised by B+ and B− G. margarita lines. Data are mean±s.d. of three biological replicates. Statistically supported differences are indicated with different letters according to a Kruskal–Wallis non-parametric test at P<0.05.

