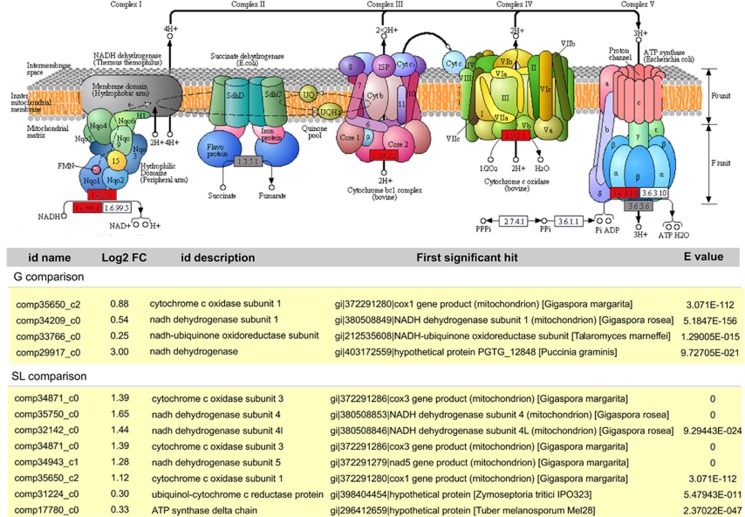
Figure 4.
Top: KEGG-based depiction of mitochondrial oxidative phosphorylation in G. margarita. Functions supported by upregulated or non-regulated transcripts are shown in red or grey, respectively. Bottom: list of the transcripts related to mitochondrial oxidative phosphorylation as upregulated by the endobacterial presence under G and SL conditions.

