Figure 5.
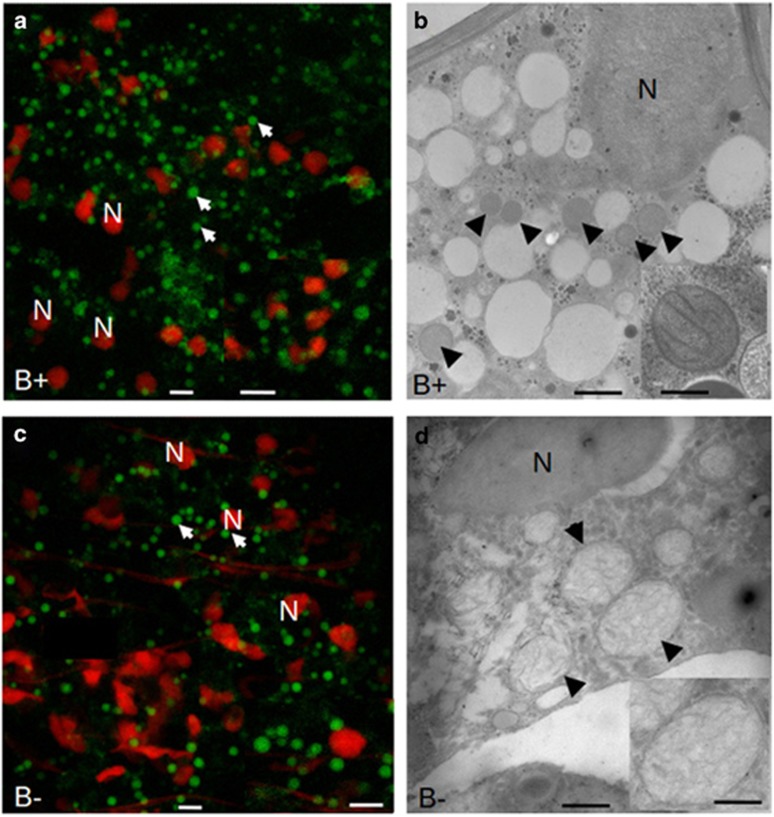
Confocal (left) and electron microscopy (right) images illustrating the shape and morphology of mitochondria from B+ and cured (B−) G. margarita spores. Mitochondria (arrow) were detected by staining with MitoTracker Green, and fungal nuclei (N) with propidium iodide. The inset on the right column reveals the cristae organisation and the differences in the matrix. Bars correspond to 5 μm in a, c and their insets, to 0.7 μm in b and to 0.16 μm in the inset, and to 0.7 μm in d and to 0.4 μm in the inset.

