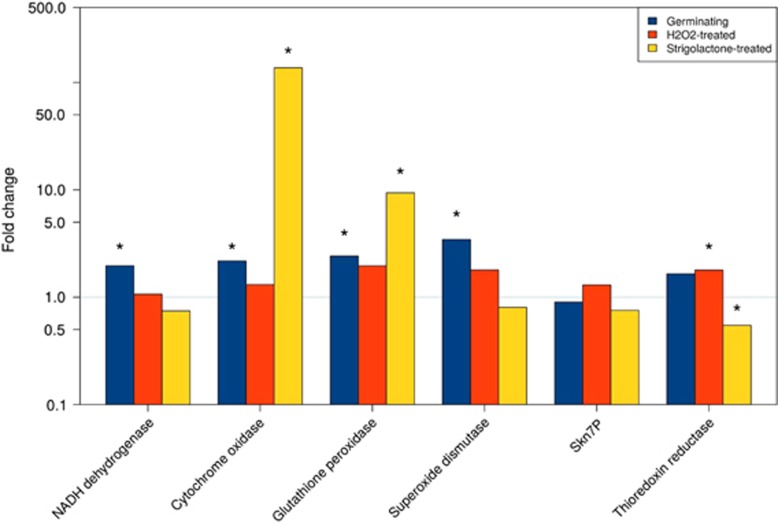
Figure 7.
Relative quantification of gene expression as obtained for a set of mitochondrial and ROS-related genes. Fold change is calculated for each gene in the B+ versus B− line in germinating, H2O2- and SL-treated spores with the basal expression recorded in the B− condition (threshold line at fold change=1). Statistically significant data (Kruskal–Wallis non-parametric test, P<0.05) are marked with an asterisk.

