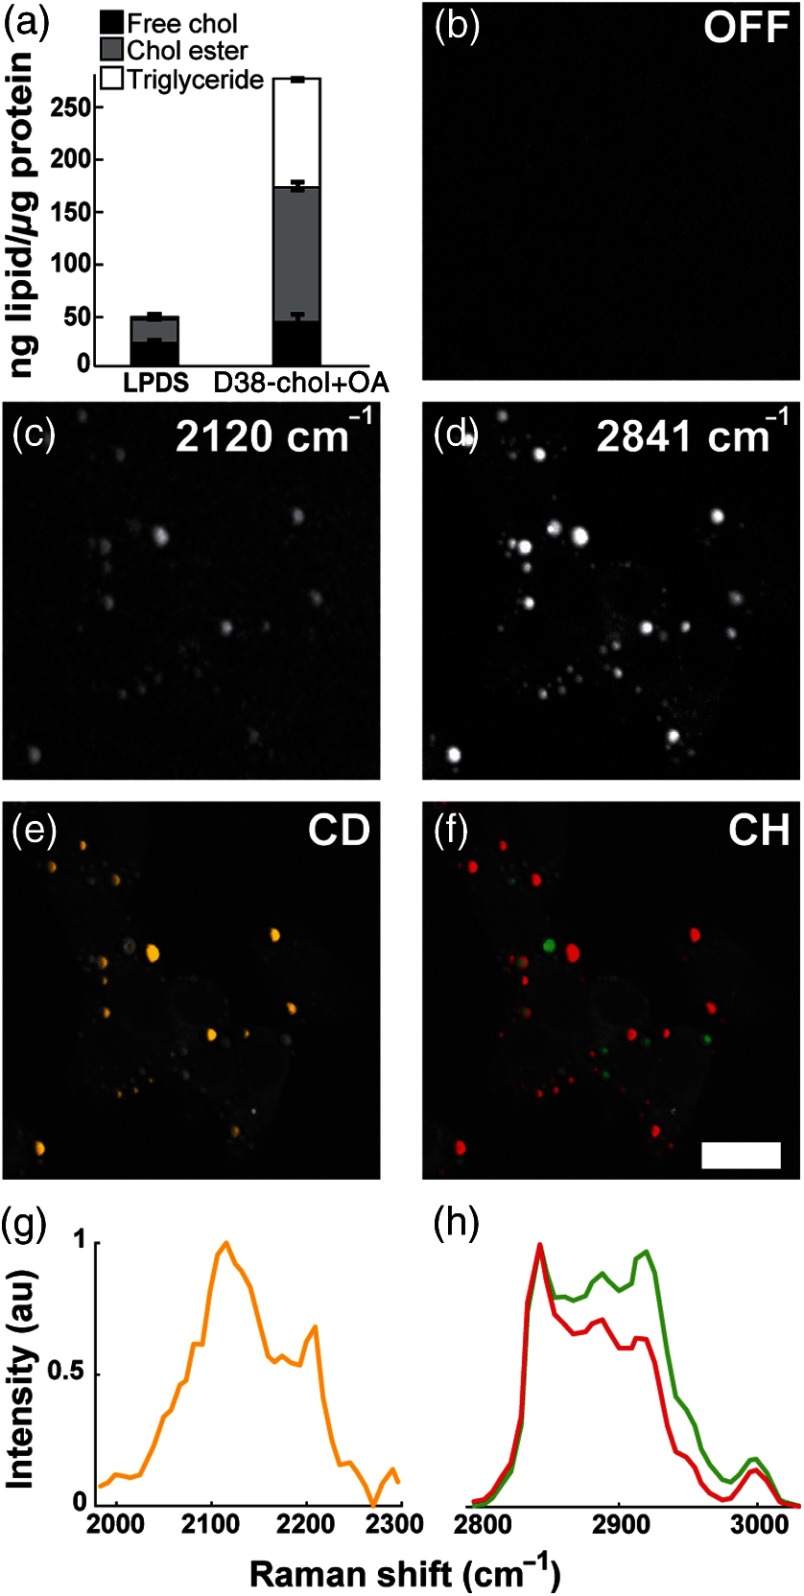
Fig. 5.
Visualization of lipid droplet heterogeneity in steroidogenic cells using D38-cholesterol. Y1 adrenal cells were treated with D38-cholesterol/cyclodextrin together with oleic acid for 24 h. Cells were either used for lipid quantification (a) or subjected to SRS imaging [(b) , off resonance; (c) , CD2 stretches; and (d) , symmetric stretches]. (Note that LPDS control treatment is the same as in Fig. 3.) The result of hyperspectral SRS imaging and multivariate analysis is depicted in yellow for D38-cholesterol in the CD region (e and g), and in red and green for the lipids in the CH region (f and h). The results are overlaid on the maximum intensity projection of the CH spectral range, shown in gray scale, which outlines the cellular morphology. Normalized spectra. .

