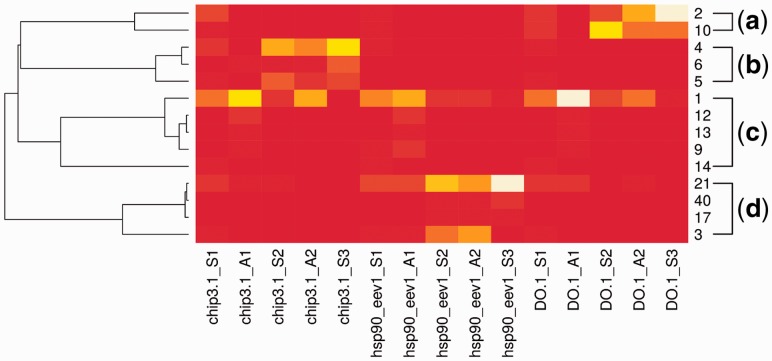
Fig. 3.
A heatmap of sequence occurrences in all categories for 14 of the largest clusters. Each row represents a category profile corresponding to one cluster (cluster ids are listed on the right side) and each column represents one category. There are 15 categories—three antibodies, for each antibody three selection rounds (S1, S2 and S3) and two amplification rounds (A1, A2). The heatmap is normalized for category. A row dendrogram is generated on the basis of row correlation [the distance between rows v1 and v2 is ], where cor is the Pearson correlation coefficient). Four major groups of category profiles [(a), (b), (c) and (d)] are highlighted

