
Fig. 4.
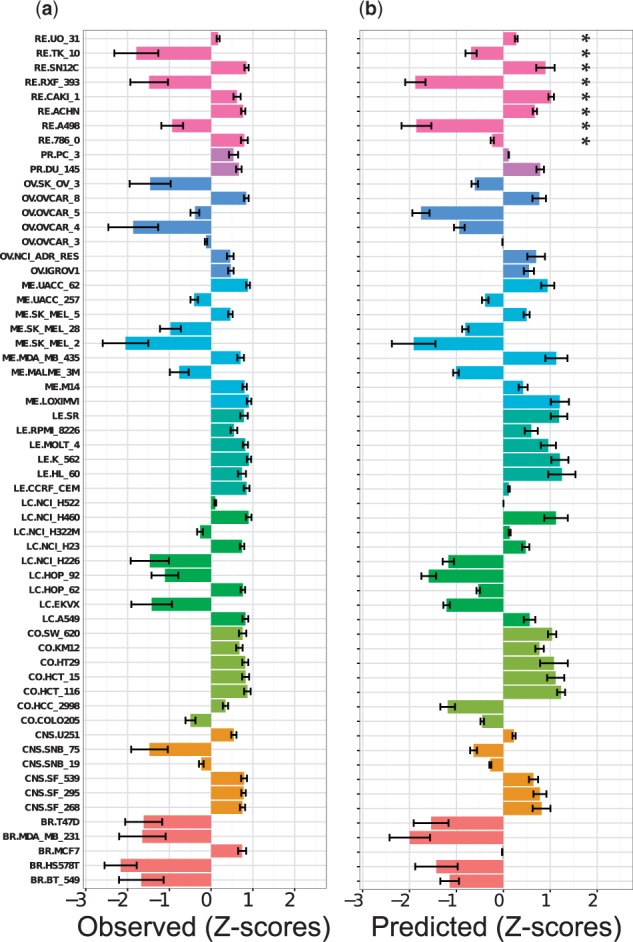
Evaluation of the predicted growth inhibition patterns for MTX on the NCI60 panel. (a) The relative growth inhibition pattern (z-scores) on the NCI60 panel was calculated from the experimental pGI50 values together with the experimental uncertainty of the measurements. (b) Predicted relative growth inhibition pattern of growth inhibition in the 10-fold CV model (i.e. interpolation) along with the 75% CI calculated using conformal prediction. Complex, and overall matching, inhibition patterns are reflected by the predictions. For instance, the TK-10, RXF-393 and A498 renal cell lines (marked with an asterisk) were predicted to be highly resistant to MTX, whereas the effect of MTX on sensitive cell lines, namely UO-31, SN12C, CAKI-1 and ACHN, was also correctly predicted. Cell lines originating from the same tissue are in the same colour (breast: red, central nervous system: orange, colon: olive green, lung cancer: dark green, leukaemia: turquoise, melanoma: blue, ovarian: blue, prostate: purple, renal: magenta)