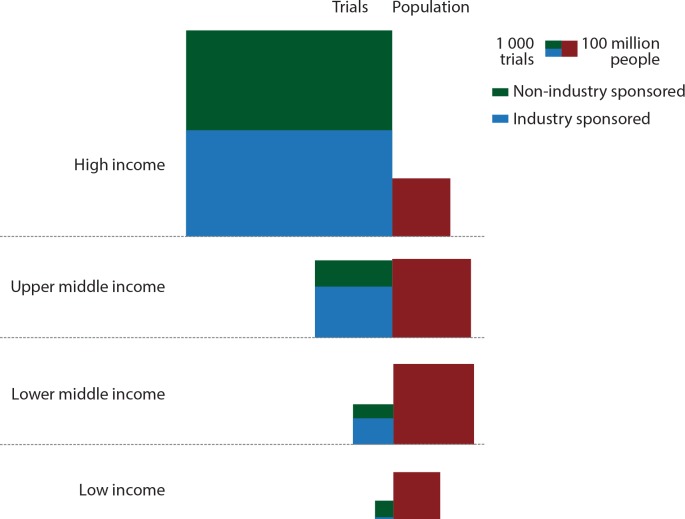
Fig 1. Distribution of clinical trials and population per income groups.
For each income group, the size of the green (blue, respectively) area is proportional to the number of industry-sponsored (non-industry–sponsored) trials initiated during the 2006–2013 period, and the size of the red area is proportional to the population as of 2012. Equal-sized trial and population squares correspond to an overall density of 10 trials per million inhabitants. The proportion of industry-sponsored clinical trials was 51.6%, 66.0%, 65.4% and 9.3% in high-, upper-middle-, lower-middle- and low-income countries, respectively. In high-income countries, the density of trials ranged from 2.2 trials per million inhabitants in Trinidad and Tobago to 645.7 for Denmark. In upper-middle-income countries, it ranged from 0.05 to 225.9, with more than 50 trials per million inhabitants in four countries, all in Eastern Europe (Hungary, Bulgaria, Romania and Serbia). The variation was less pronounced in lower-middle-income countries (between 0.04 and 22.6) and low- income countries (between 0.13 and 14.0).

