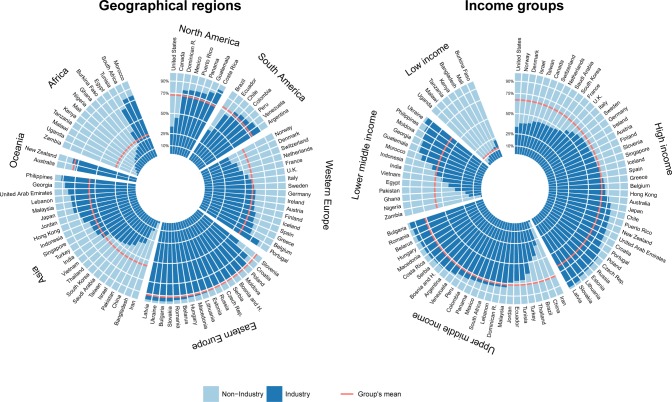
Fig 2. Sponsorship ratios of clinical trials.
The radial barplot shows the proportion of industry- sponsored clinical trials (in dark blue) in the 87 countries where at least 50 trials were initiated during the 2006–2013 period. Countries were grouped by (a) geographical region and (b) income groups. For each group of countries, the red line represents the mean proportion of industry-sponsored clinical trials. The exact sponsorship ratios per country can be found on S4 Table. In high-income countries the proportion of industry-sponsored trials ranged from 33.6% in the United States to 90% or more in seven Eastern European countries. In upper-middle- income countries, the proportion ranged from 2.1% for Iran to more than 97% for countries such as Bulgaria and Romania. In lower-middle-income countries, the proportion ranged from less than 20% in three African countries to 97.2% in Ukraine.

