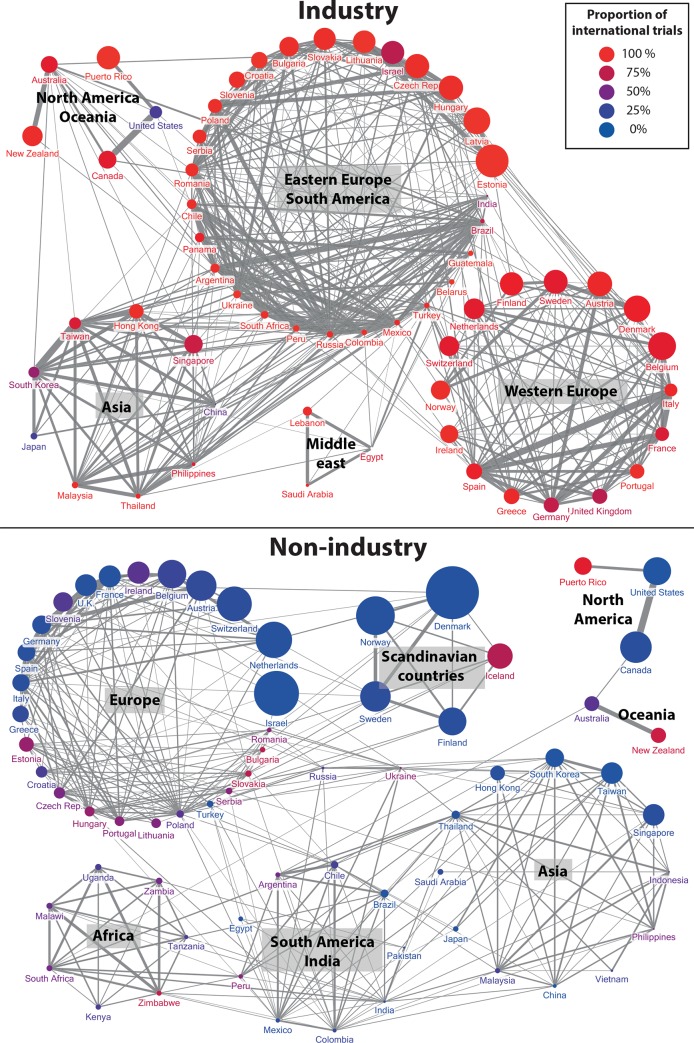
Fig 5. Industry- and non-industry–sponsored co-occurrence networks.
Country-country industry- (top) and non-industry–sponsored (bottom) networks for which links between countries are as wide as the estimated overrepresentation of the country-country collaboration. Size of nodes is proportional to the number of (top) industry- or (bottom) non-industry–sponsored clinical trials per million inhabitants. The color of the node represents the collaborative ratio of the country: the color corresponds to a gradient between blue, representing 100% of trials conducted in that country being single-country and red, 100% international trials. Among the 15 industry-sponsored most overrepresented collaborations, three were between Eastern European countries, four between South American countries, two between Asian countries, three between Western European countries (the France–Italy–Spain triangle), and the collaborations United States–Canada and Australia–New Zealand. The 15 most significantly overrepresented non-industry–sponsored collaborations were United States–Canada, United States–Puerto Rico, Australia–New Zealand, Malawi–Zimbabwe, South Korea–Taiwan, three collaborations between Northern European countries and six collaborations between other Western European countries. Among industry-sponsored collaborations, the trimming suppressed all African countries. Among non-industry–sponsored collaborations, African countries did not have overrepresented collaborations with European or North American countries.

