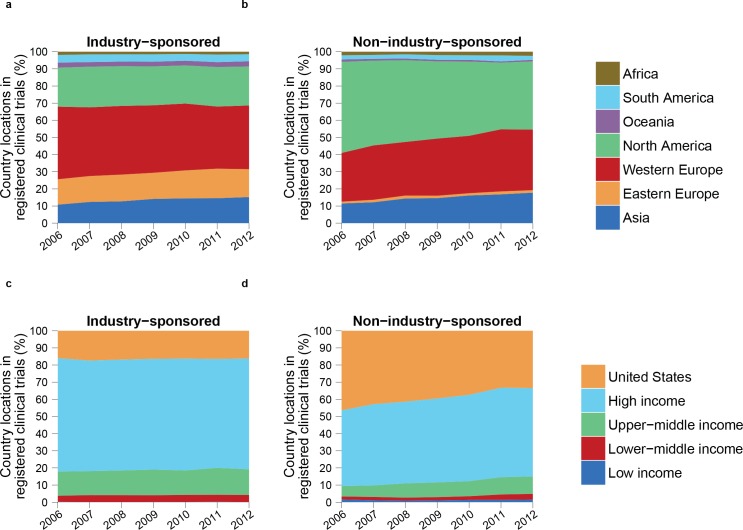
Fig 6. A differentiated global migration of clinical trials on sponsorship.
The annual distribution of country trial locations of clinical trials initiated between 2006 and 2012. Countries were grouped by (top) geographical regions and (bottom) income groups, and trials were classified on sponsor type: (left) industry- and (right) non-industry–sponsored. Country-locations of international trials were considered individually: a trial conducted simultaneously in two South American countries would count twice when calculating the share of South America. For income groups, data for the United States and other high-income countries are shown separately. The proportion of trials initiated in Asia increased by a similar amount for both sponsor types (from 10.8% to 15.2% for industry and from 11.5% to 17.8% for non-industry). The proportion of trials initiated in Africa, South America, Oceania, and Eastern Europe remained stable for both sponsor types. The distribution of trials by income groups remained stable for industry-sponsored trials. For non-industry–sponsored trials, the proportion of trials initiated in high-income countries was 90.6% in 2006 and 85.0% in 2012, and the proportion of trials initiated in upper-middle-income countries was 6.1% in 2006 and 10.2% in 2012. The proportion of lower-middle- and low-income groups remained stable for non- industry–sponsored trials. The exact share of country trial locations of industry- and non-industry-sponsored trials per geographic region can be found on S7 and S8 Tables respectively. The exact share of country trial locations of industry- and non-industry-sponsored trials per income group can be found on S9 and S10 Tables respectively.

