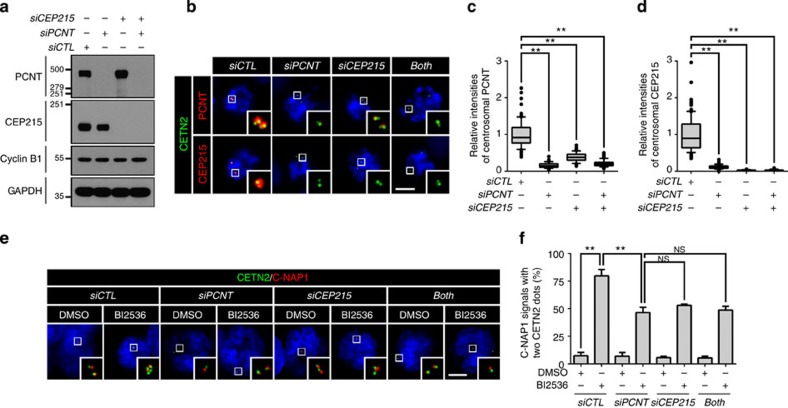
Figure 5. Centriole separation in the PCNT- and/or CEP215-depleted cells.
(a–d) Depletion of PCNT and CEP215 was confirmed with immunoblot (a) and co-immunostaining (b) with the PCNT and CEP215 antibodies. Scale bar, 10 μm. (c,d) Centrosomal intensities of PCNT and CEP215 in mitotic cells were determined and shown with the box-and-whisker plot. n=90 per group in three independent experiments. (e) The PCNT- and/or CEP215-depleted cells were arrested at M phase, treated with BI2536 for 3 h, forced to exit mitosis with ZM447439 (ZM) for 2 h and co-immunostained with antibodies specific to centrin-2 (CETN2, green) and C-NAP1 (red). Scale bar, 10 μm. (f) Centriole association was determined with the 2:1 ratio of centrin-2 and C-NAP1. Values are means with s.d.'s. n=300 per group in three independent experiments. The statistical significance was determined by unpaired two-tailed t-test in Prism 6 (not significant (NS), P>0.05; *P<0.05; **P<0.01).

