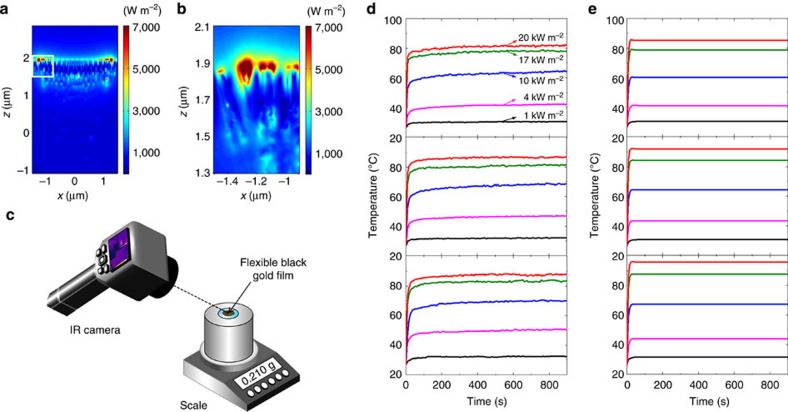
Figure 5. Thermal responses of the black gold membranes.
(a) Simulated heat flux profile around the black gold membrane illuminated with 20 kW m−2. (b) Enlarged heat flux profile for the region indicated by a box in a. (c) Schematic image of water surface temperatures measurement. (d) Experimentally measured water temperature as a function of time for one-layer (top), two-layer (middle) and three-layer (bottom) black gold membranes. (e) Simulated water temperature as a function of time for one-layer (top), two-layer (middle) and three-layer (bottom) black gold membranes.

