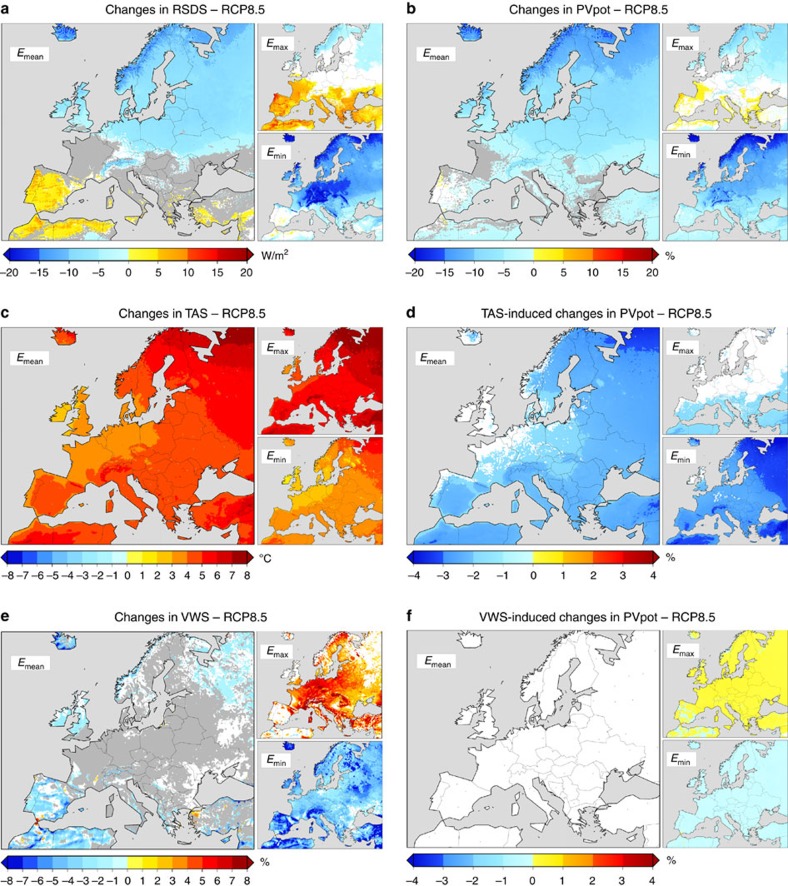
Figure 1. Climate change projections under RCP8.5.
Changes projected in the mean values of (a) RSDS, (b) PVpot, (c) TAS and (e) VWS under the RCP8.5 to the end of this century (2070–2099 versus 1970–1999) obtained from the Emean, Emax and Emin over land. Emax and Emin values are coloured only if they are significant (p<0.05) within their corresponding ensemble member, otherwise they are depicted in white. Emean values are coloured only if they are robust, in white if they are negligible and in grey if they are uncertain. (d,f) The Emean, Emax and Emin changes in PVpot that would be induced by the changes in either TAS alone or VWS alone. See the Methods section for details.

