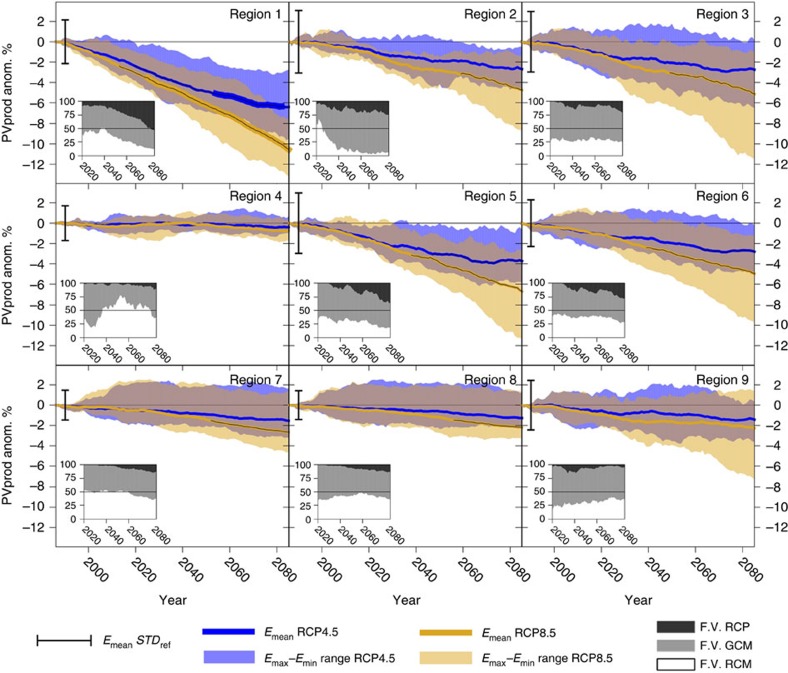
Figure 3. Time series of PV power production along the 21st century under both RCP4.5 and RCP8.5.
Thirty-year running mean time series of the estimated PV power production anomalies under both the RCP4.5 (blue) and the RCP8.5 (orange) in each region. Anomalies are computed with respect to the mean values in the reference period 1970–1999 and expressed in %. Solid lines depict the ensemble mean values, with the widest segments, appearing only in the first plot (region 1), indicating S2N>1. Shadows show the ensemble spread. Vertical black bars depict 0±the ensemble mean value of the standard deviation of the annual series of PV power production anomalies in the reference period, as representative of the current natural variability. If the ensemble mean change exceeds such a quantity, a thin black line is superimposed on the ensemble mean series. Small subplots depict the fraction of variance (in %) explained by the change of RCP (dark-grey shadow), GCM driving run (light-grey shadow) or RCM (white shadow), as obtained from an analysis of variance applied to the whole set of 30-year running mean time series of PV power generation anomalies considering only the scenario period. See the Methods section for details.

