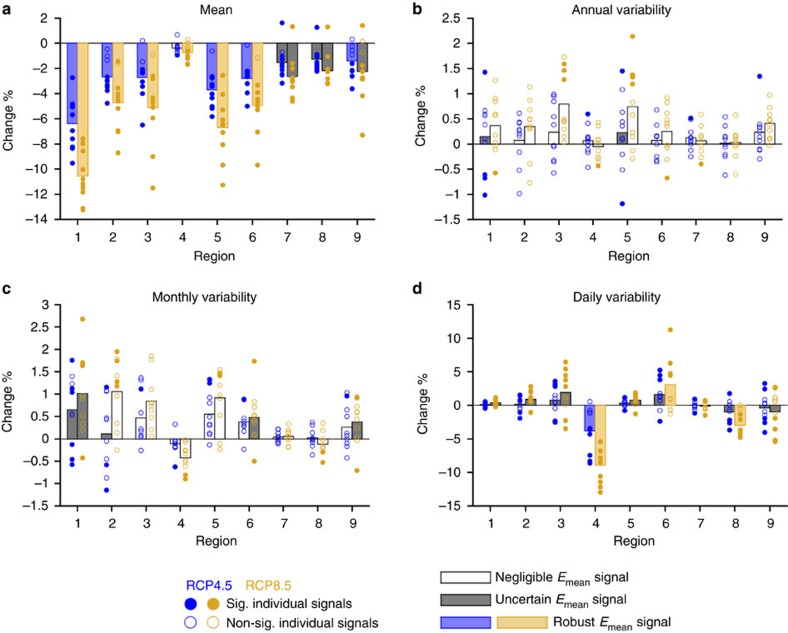
Figure 4. Projected changes in the mean and the time variability of the PV power production series.
Changes projected to the end of this century (2070–2099 versus 1970–1999) in (a) the mean, (b) the annual variability, (c) the monthly variability and (d) the daily variability of the PV power production series of each region under both the RCP4.5 (blue) and the RCP8.5 (orange). The individual signals corresponding to each ensemble member are depicted by circles: filled if they are significant, empty if not. Boxes represent ensemble mean signals: coloured, white or grey if robust, negligible or uncertain, respectively. See the Methods section for details.

