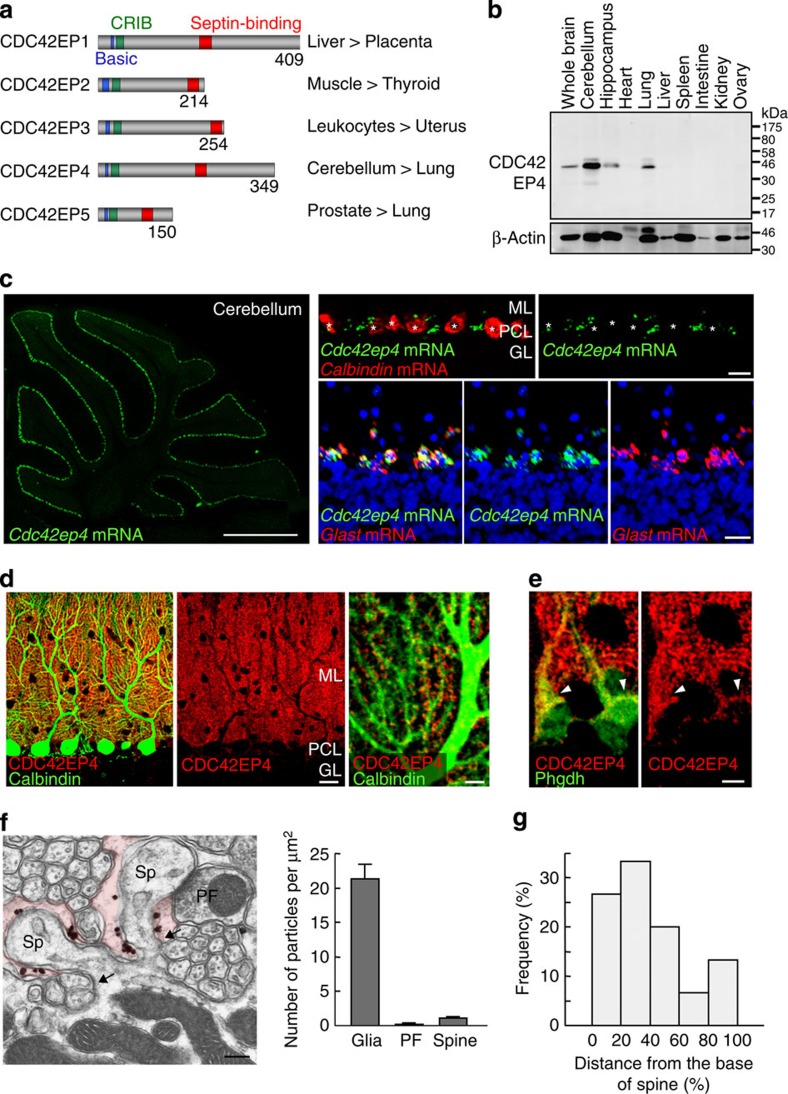
Figure 1. Bergmann glia-selective expression and unique perisynaptic localization of CDC42EP4.
(a) The CDC42EP/BORG family and gene expression pattern in the mouse. Each CDC42EP contains a set of basic-CRIB-BD domains. Anti-CDC42EP4 antibody was raised against a region between the CRIB and BD3 (septin-binding) domains. The numbers denote amino-acid residues. CDC42EP1/2/3/4/5, respectively, corresponds to BORG5/1/2/4/3. (b) Lysates from adult mouse tissues (50 μg total protein per lane) were immunoblotted for CDC42EP4 and were reprobed for β-actin as a loading control. The major ∼39-kDa band was most abundant in the cerebellum. (c) FISH for Cdc42ep4 mRNA in the adult mouse cerebellum. (Left) Labels for Cdc42ep4 (green) highlighted the PC layer in a parasagittal section. (Top) Double-label FISH for mRNAs for Cdc42ep4 and a PC marker calbindin (red). Cdc42ep4 mRNA was excluded from PCs (*). (Bottom) Double-label FISH for Cdc42ep4 and Glast (red) mRNAs, and TOTO-3 stain for DNA (blue). The two mRNA signals overlapped in all (n=115) Bergmann glial cells identified in a representative section. Scale bars, 1mm and 20 μm. (d) (Left and centre) Double-label IF for CDC42EP4 (red) and calbindin (green) in the cerebellar cortex. The diffuse granular signals for CDC42EP4 distributed throughout the molecular layer and in the PC layer, which were excluded from PCs and the granule cell layer. (Right) At a higher magnification, CDC42EP4-positive puncta were interspersed and aligned along PC dendrites. Scale bars, 20 and 5 μm. (e) Double-label IF for CDC42EP4 (red) and a Bergmann glial marker Phgdh (green). The limited overlap in Bergmann glial cell bodies (arrowheads) indicated selective localization of CDC42EP4 in glial processes. Scale bar, 5 μm. (f) (Left) Immunoelectron microscopy image for CDC42EP4 in the molecular layer. Gold particles for CDC42EP4 were found as submembranous clusters in terminal processes of Bergmann glia (tinted), each surrounding a dendritic spine (Sp) of a PC. PF, parallel fibre terminal. Scale bar, 200 nm. (Right) Quantification of glia-selective localization of CDC42EP4. Data represented as mean±s.e.m. (g) Histogram showing a gradient of CDC42EP4 signals relative to the geometry of dendritic spines of PCs; higher in regions facing spine base (arrows in f) than in regions facing the spine head.

