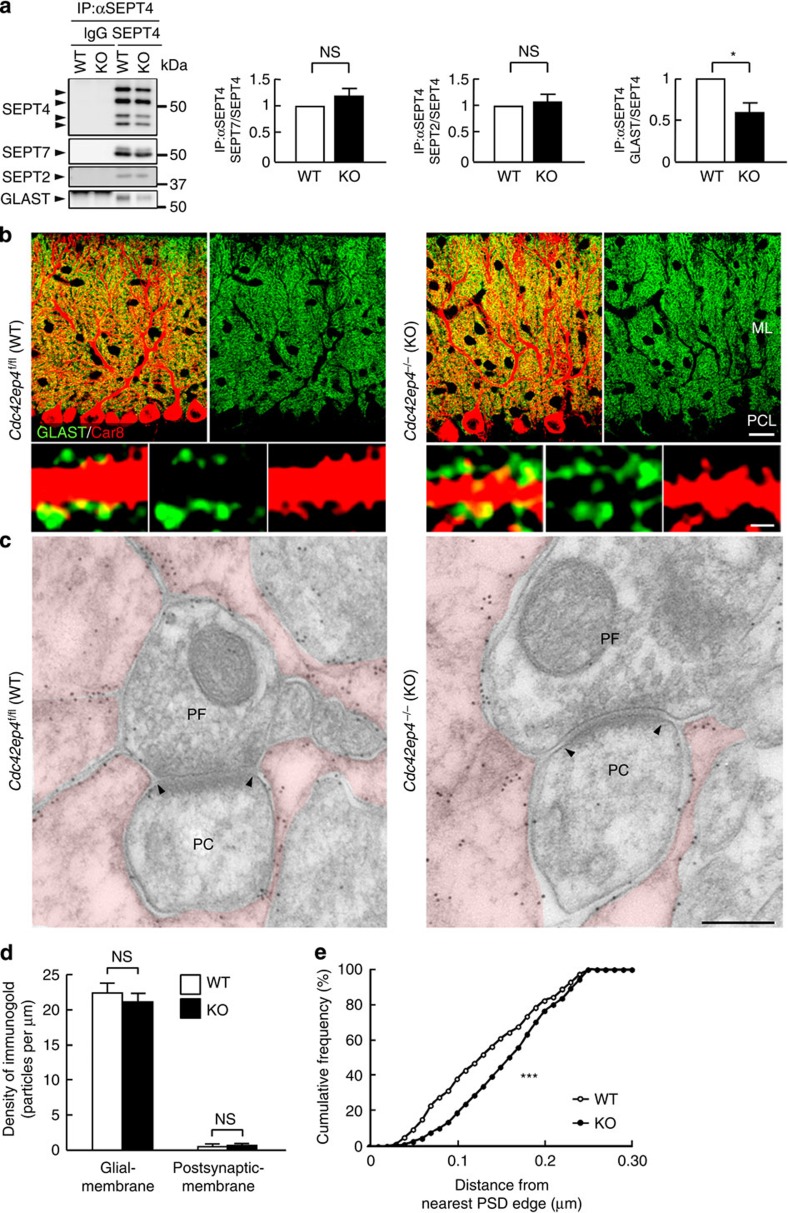
Figure 5. Loss of CDC42EP4 dissociates the GLAST–septin interaction and delocalizes GLAST away from synapses.
(a) Quantitative co-IP/IB assay between SEPT4 and SEPT7, SEPT2 or GLAST in WT and KO cerebellar lysates. While the interaction among the septin subunits did not differ, the relative amount of GLAST pulled down with SEPT4 from KO lysate was significantly less than that from WT (n=3, *P<0.05, NS, P>0.05 by t-test), indicating that septin–GLAST interaction depends on CDC42EP4. See Fig. 4a–d for the comparable amount and solubility of these proteins in WT and KO cerebella. (b) Double-label IF for GLAST (green) and a Purkinje cell marker Car8 (red) in WT and KO cerebellar cortices. Genetic loss of CDC42EP4 caused no recognizable difference in the distribution of GLAST up to the resolution. Scale bars, 20 and 1 μm. (c) Immunoelectron microscopy images for GLAST in WT and KO molecular layers. PF, parallel fibre terminal or bouton. PC, dendritic spine of Purkinje cell. Bergmann glial processes are tinted. The pattern of GLAST distribution appears comparable to that of a previous study4. Scale bar, 200 nm. (d) Quantitative analysis of immunoelectron microscopy data. Bergmann glia selectivity and labelling density of GLAST were comparable between WT and KO mice: Bergmann glia; 22.4±1.3/21.1±1.2 particles per μm (n=519/467 particles from two littermate pairs, NS, P>0.05 by Mann–Whitney U-test). Postsynaptic membrane; 0.50±0.21/0.68±0.24 particles per μm (n=5/8 particles, P=0.68 by Mann–Whitney U-test; cf. Figs 4d and 5a–c). (e) Cumulative histogram of the distance of GLAST measured from the nearest PSD edge (for example, arrowheads in c). A significant right shift of the curve for KO mice demonstrates delocalization of GLAST away from PSDs of PF–PC synapses (median, WT=0.27 μm, KO=0.31 μm from the nearest edge of PSD; n=22/19 synapses from two littermates for each genotype, ***P<0.001 by Kolmogorov–Smirnov test).

