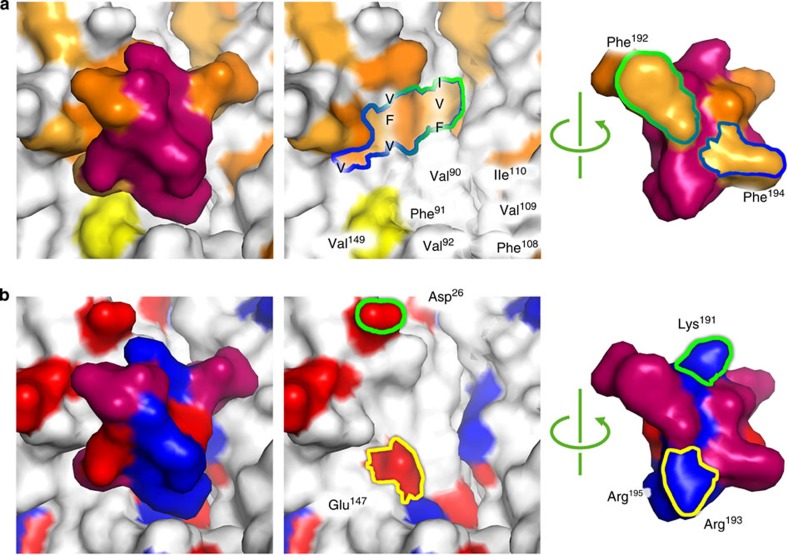
Figure 4. Interactions between the C-terminal extension and the neighbouring S subunit.
(a) EM-derived atomic model for the eVLP S subunit and C-terminal extension represented as a surface model and coloured according to hydrophobicity (I, L and V: orange; G, A and F: pale orange; C and M: yellow). The middle panel shows the surface of the S subunit with the C-terminal extension removed, and the right panel shows the surface of the C-terminal extension that interacts with the S subunit. Hydrophobic residues are labelled. (b) As in a coloured according to charge (red is negative, blue is positive). The charged residues from S subunit are labelled. All residues in Fig. 4 are from the S subunit.

