
Figure 2. Scatter dot plot representing the DockTope validation values for 135 pMHC-I structures from the PDB.
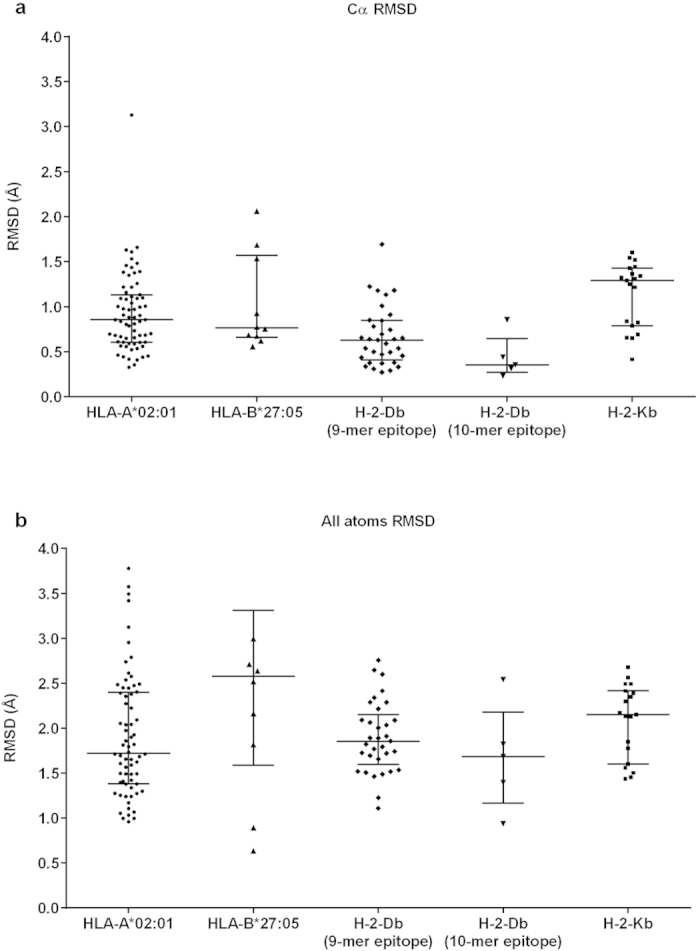
The validation process was performed through cross-docking, considering the Cα (a) and all atoms (b) RMSD for each epitope. Each point represents the value for a reproduced structure. The statistic data are shown as a median with interquartile range (25% to 75%). On the y-axis, RMSD stands for Root Mean Square Deviation; on the x-axis, the MHC types are represented.