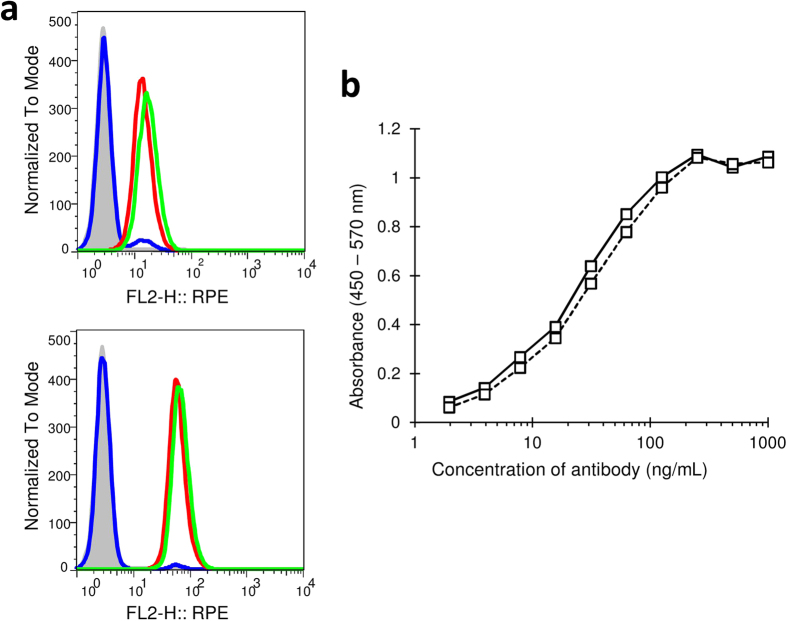
Figure 3. Binding activities of KMTR2 and its mutant (LkN53R) to TRAIL-R2.
(a) Flow cytometry results. Antibody concentrations are 100 ng/mL (upper) and 1000 ng/mL (lower). X-axis indicates R-phycoerythrin (RPE) fluorescence signal intensity. Data for KMTR2, LkN53R mutant, and aDNPG1 (negative control) are shown as green, red, and blue lines, respectively. Gray-colored histogram is the control (2nd-PE). (b) ELISA results. Data for KMTR2 and the LkN53R mutant are shown as solid and dashed lines, respectively. Both in the flow cytometry and ELISA experiments, independent experiments were performed three times, and a representative result is shown, respectively.

