. 2015 Dec 17;5:18389. doi: 10.1038/srep18389
Copyright © 2015, Macmillan Publishers Limited
This work is licensed under a Creative Commons Attribution 4.0 International License. The images or other third party material in this article are included in the article’s Creative Commons license, unless indicated otherwise in the credit line; if the material is not included under the Creative Commons license, users will need to obtain permission from the license holder to reproduce the material. To view a copy of this license, visit http://creativecommons.org/licenses/by/4.0/
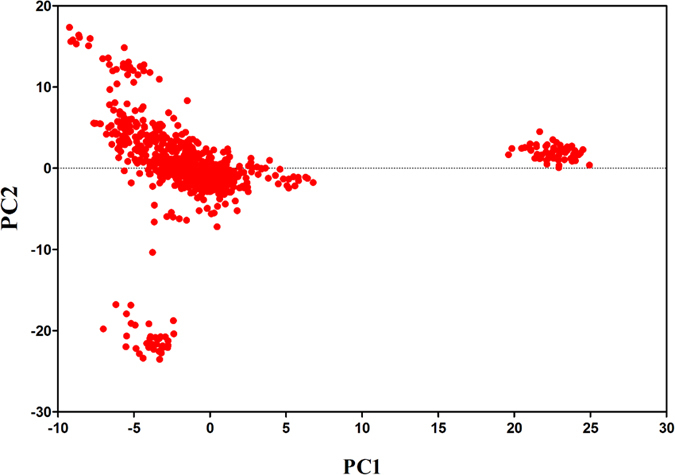
Figure 1. Population structure map drawn from the first two principal components.

