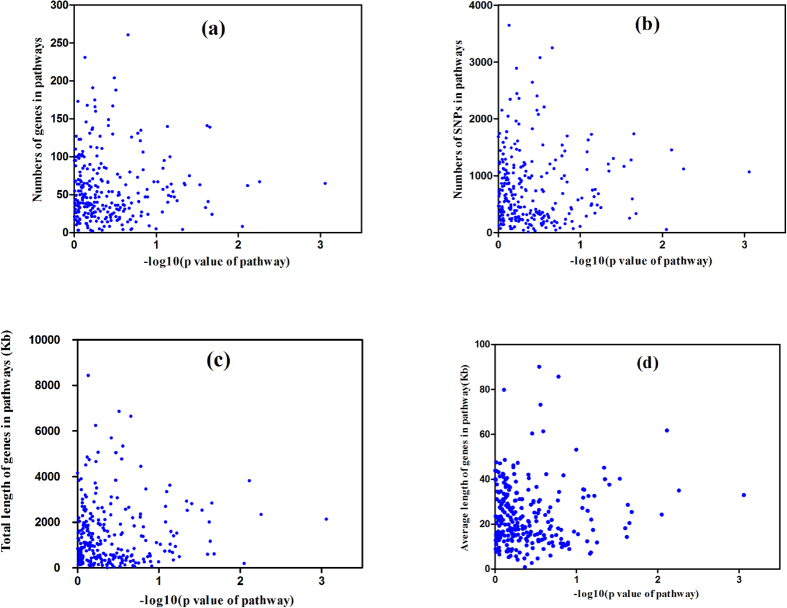
Figure 4.
Significance of the pathway (–log10 and P-values) for the live weight trait versus (a) the number of genes in the pathways, (b) the number of significant single nucleotide polymorphisms (SNPs) in the pathways, (c) total length (kb) of genes in the pathways, and (d) mean length (kb) of the genes in the pathways.

