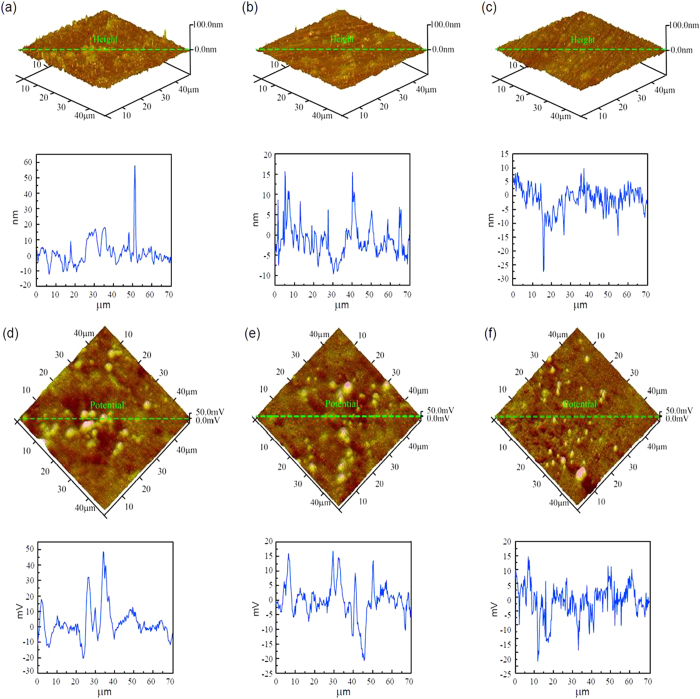
Figure 4.
AFM topographic images of the adsorption of BSA on CoCrMo alloy surfaces at an applied −0.8 V voltage at pH 3.0 (a), pH 4.7 (b) and pH 10.0 (c), and the corresponding SKPFM images at pH 3.0 (d), pH 4.7 (e) and pH 10.0 (f). The curves under each figure show the ups and downs of morphology and the potential of the green line on each image.

