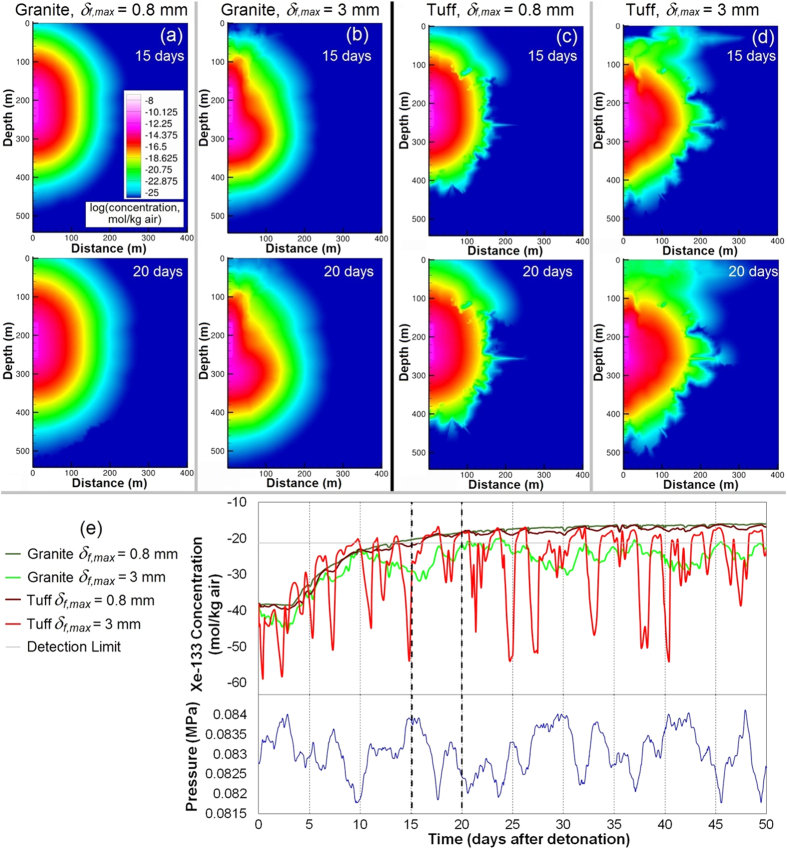
Figure 4. Comparison between granite and tuff at the minimum (0.8 mm) and maximum (3 mm) fracture aperture maximum (δf,max).
(a–d) Concentration plots for granite and tuff with varying δf,max, shortly after a barometric high pressure period (15 days) and during a barometric low (20 days). (e) Breakthrough curves at the centerline surface node for granite and tuff with δf,max of 0.8 and 3 mm and barometric pressure for the first 50 days.

