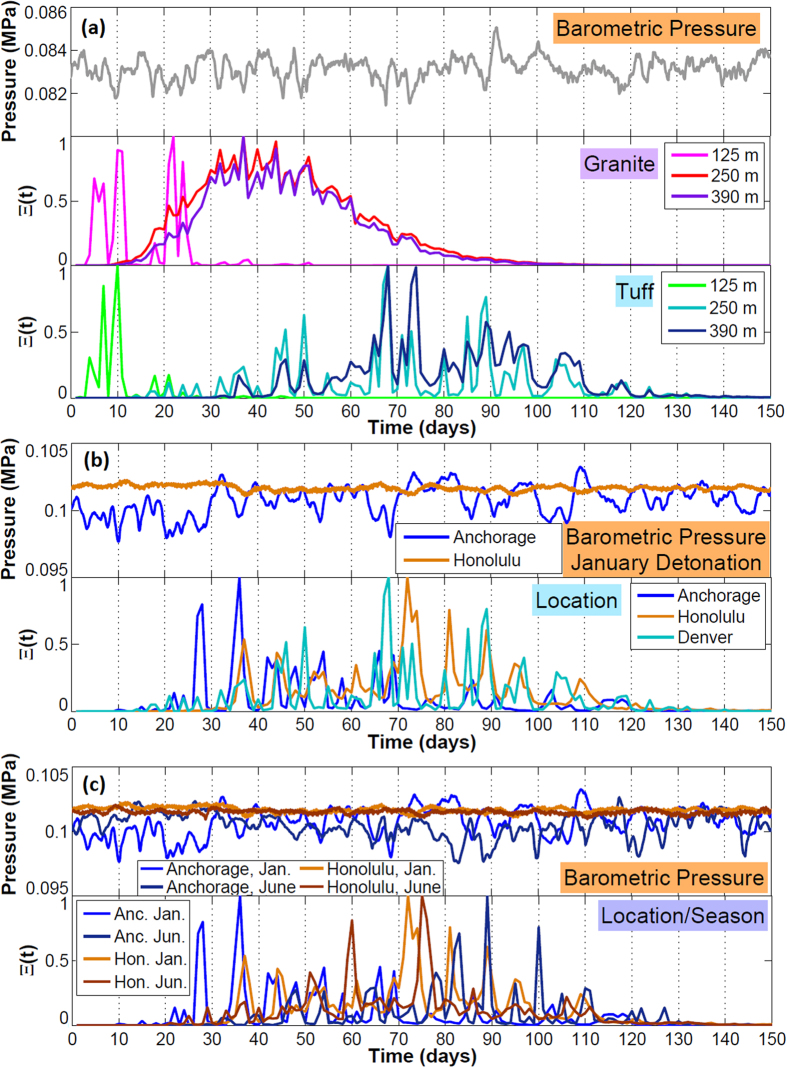
Figure 5. Normalized detection probability plots from stochastic simulations.
(a) Barometric pressure for Denver, January; normalized detection probability, Ξ (t), for granite and tuff at all depths. (b) Barometric pressure for Anchorage and Honolulu, January; Ξ (t) for tuff (250 m) at all locations. (c) Barometric pressure for January and June detonations; Ξ (t) for tuff (250 m) at two locations and seasons.

