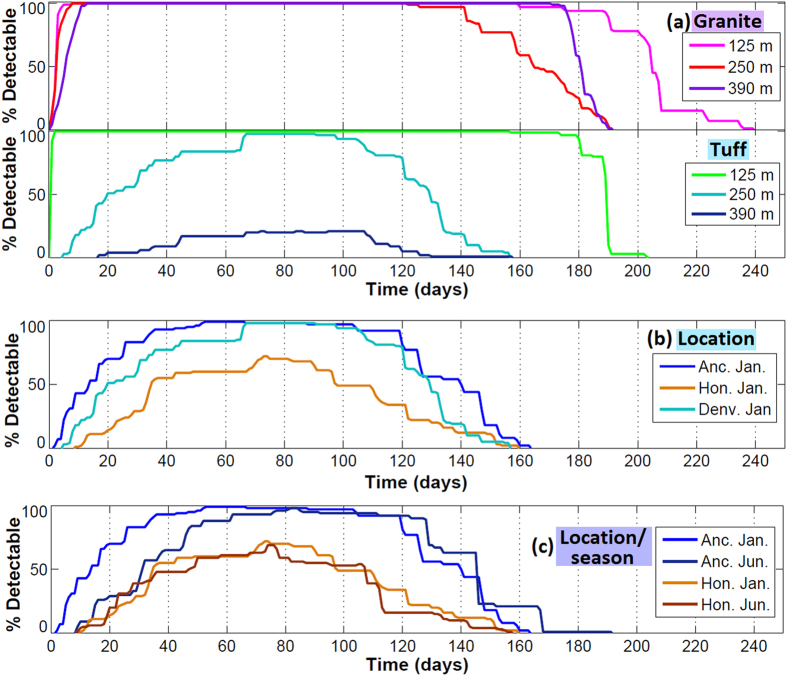
Figure 6. Percent of stochastic simulations with detectable 133Xe by day after the detonation.
(a) Different rock types (granite and tuff) and depths of burial, for a January detonation with Denver pressure data. (b) Different locations, for a January detonation, in tuff at 250 m depth of burial. (c) Different locations and seasons, January and June detonations in Anchorage and Honolulu, in tuff at 250 m depth of burial.

