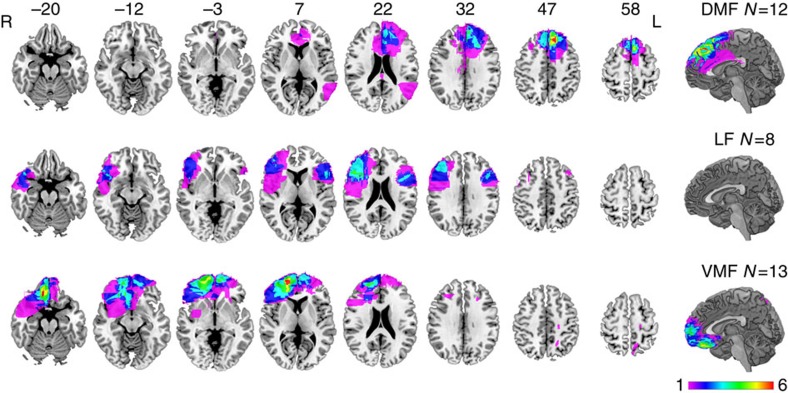
Figure 1. Representative axial slices and mid-sagittal view of the MNI brain showing extent of lesion overlap in frontal damaged groups.
Rows show lesion overlap in the dorsomedial frontal (DMF), lateral frontal (LF) and ventromedial frontal (VMF) groups. Numbers above slices indicate z coordinates of axial slices in MNI space. Colours indicate the extent of lesion overlap, as indicated by the colour scale. L, left; R, right.

