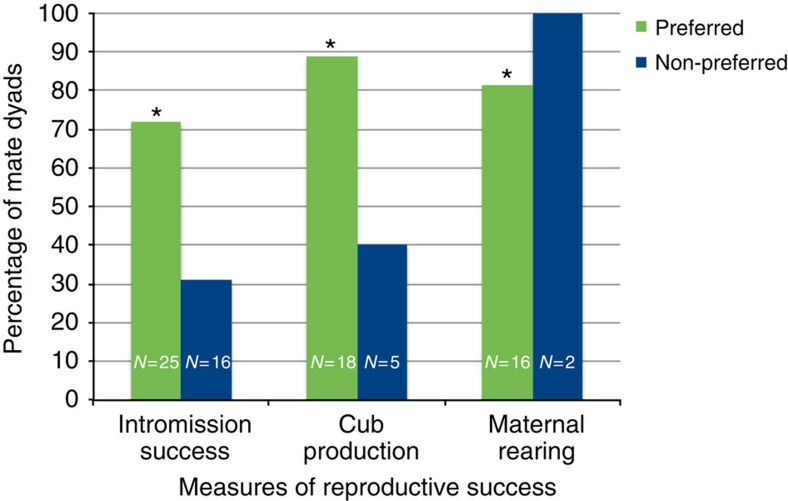
Figure 1. Female giant panda preference.
Data have been pooled across years and total sample sizes are shown on the columns. Green bars represent preferred mates and blue bars represent non-preferred mates. Intromission success (χ2=7.35, P=0.007); cub production (χ2=10.9, P=0.001); maternal rearing† (χ2=8.07, P=0.005). *indicates P≤0.05 for χ2 test. P values were obtained via χ2 tests for graphing purposes only. †Low sample sizes preclude statistical analysis in a GLMM for this variable.

