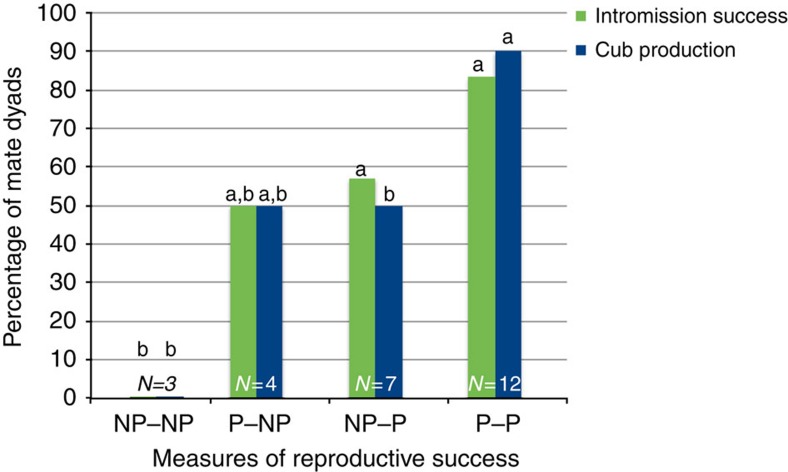
Figure 3. Percentage of mate dyads for different combinations of male and female preference.
Male is non-preferred and female is non-preferred (NP–NP), female prefers male but male does not prefer female (P–NP), female does not prefer male but male prefers female (NP–P), and both animals prefer each other (P–P). Dark bars represent intromission success and light grey bars represent cub production. N indicates number of dyads total in the group. Different letters (a,b) indicates significant differences among groups on intromission success and cub production (P≤0.05 using a Tukey HD post hoc test, actual statistics presented in Table 3 and in the text).

