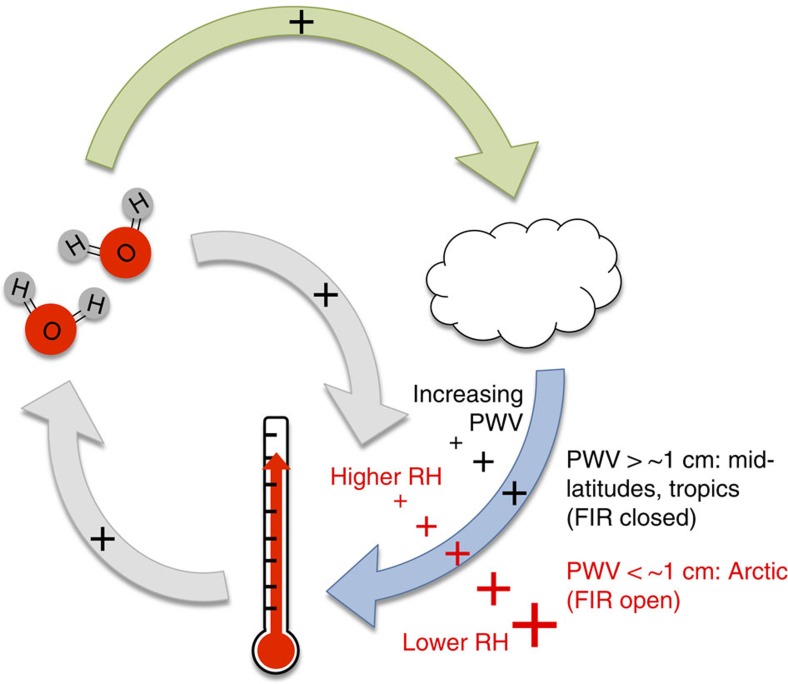
Figure 1. Conceptual diagram of Arctic feedbacks relevant to CRE.
Conceptual diagram of Arctic feedbacks involving surface temperature, atmospheric water vapour and clouds. The grey arrows represent the ‘water vapour feedback'21. The green arrow represents the subsequent change in cloud properties; for example, an increase in the amount of clouds23 increases the surface temperature via increased CRE (blue arrow). The magnitude of the black and red plus (+) symbols represents perturbations to the CRE feedback; note that the total change in CRE is influenced by changes in cloud properties as well. Increasing atmospheric water vapour dampens the increase in CRE feedback from changing cloud properties, indicated by decreasing black ‘+' symbols. When the FIR is open, as relative humidity (RH) decreases, the CRE feedback increases (red ‘+' symbols increasing), as described in this study.

