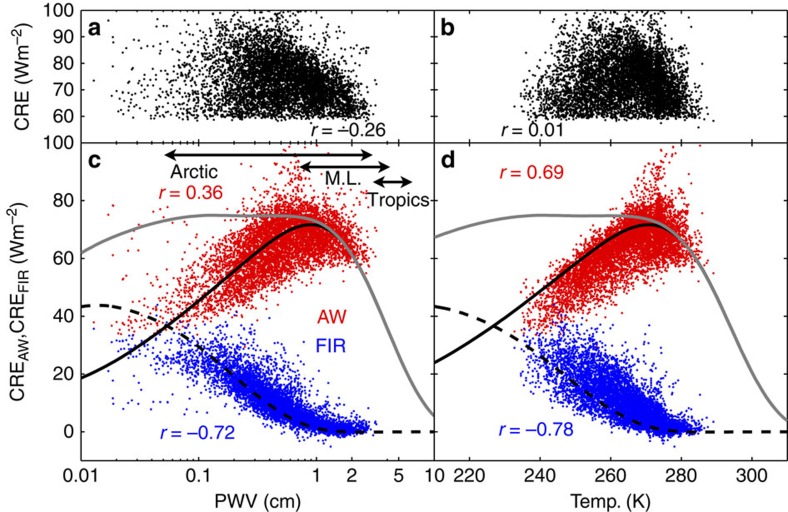
Figure 2. CRE in the FIR and the atmospheric window.
(a) Observations of 3-hour averages of downwelling infrared CRE from Barrow, Alaska; Eureka, Canada and Summit Station, Greenland, plotted as a function of PWV. Only CRE>60 W m−2 are shown to highlight clouds that are optically thick. (b) Same as a, but plotted as a function of near-surface air temperature. (c,d) are similar to a,b, but are separated into spectral components from the atmospheric window (CREAW, red points) and the far-infrared (CREFIR, blue points). For reference, the arrows in c are the approximate ranges of PWV for the Arctic, mid-latitudes (M.L.) and Tropics. Curves in c,d are radiative transfer calculations of CREFIR (dashed black), CREAW (solid black) and their sum CRE=CREFIR+CREAW (grey).

