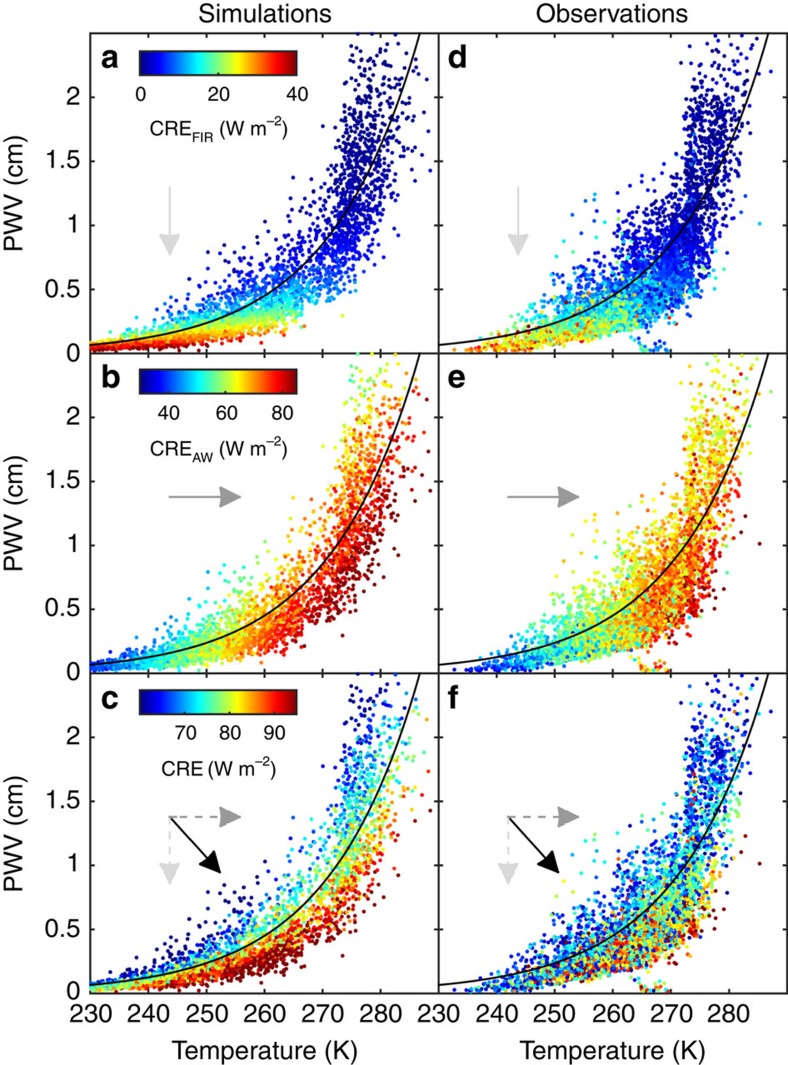
Figure 4. Simulated and observed CRE as functions of temperature and PWV.
Simulations (left panels (a–c)) and observations (right panels (d–f)) of the downwelling infrared CRE in the far-infrared (top panels (a,d)), atmospheric window (middle panels (b,e)) and the total CRE (bottom panels, (c,f)). The simulations are from radiative transfer calculations using observed profiles of temperature and humidity acquired by radiosoundings at Barrow, Alaska and Eureka, Canada. The black line is the Clausius–Clapeyron relationship for near-surface air temperature and PWV following ref. 29 and assuming a relative humidity (with respect to liquid) of 100% and a scale height of 3 km. The observed values are data from Barrow and Eureka, but only for clouds with large optical depths (CRE>60 W m−2). As a visual aide, arrows show the direction in the temperature–PWV space of increasing CRE, also shown as coloured symbols. Note that the colour scale changes for each row.

