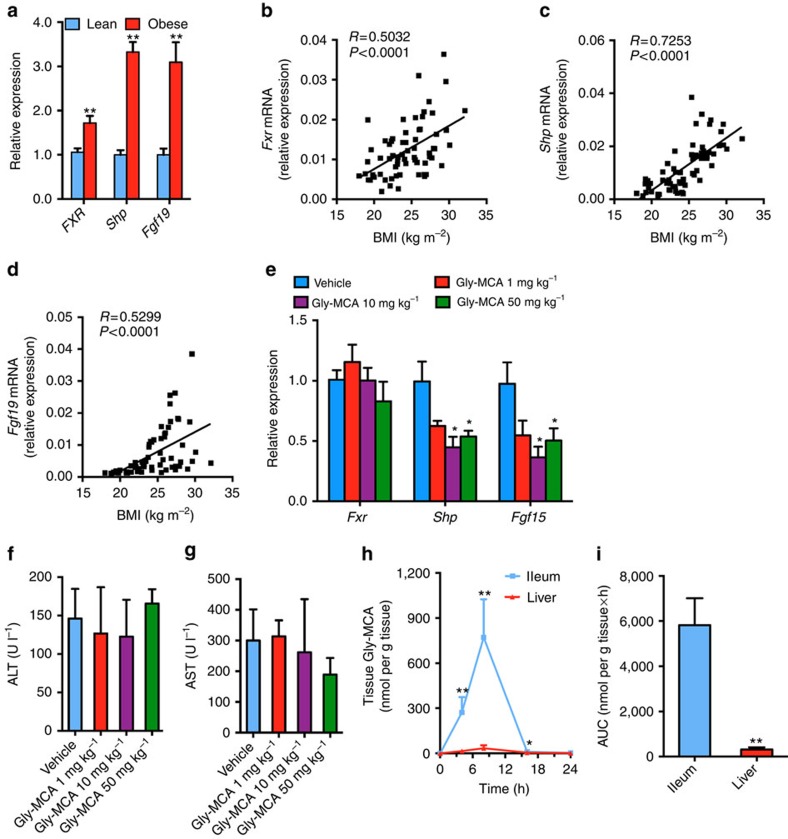
Figure 1. Gly-MCA is an FXR inhibitor.
(a) mRNA levels of FXR target genes in lean (n=36) and obese (n=30) human ileum biopsies. Expression was normalized to 18S RNA. Data are presented as mean±s.e.m. Two-tailed Student's t-test. **P<0.01 compared with healthy humans (lean). (b–d) Correlation of Fxr (b), Shp (c) and Fgf19 (d) mRNA expressions in human ileum biopsies with body mass index (BMI). n=66 total individuals. Expression was normalized to 18S RNA. (e) Fxr, Shp and Fgf15 mRNA levels in the ileum of mice after 24 h treatment with Gly-MCA. Expression was normalized to 18S RNA. Vehicle group n=5, Gly-MCA group n=6. Data are presented as mean±s.d. Two-tailed Student's t-test. *P<0.05 compared with vehicle. (f,g) Serum ALT (f) and AST (g) levels of mice after 24 h treatment with Gly-MCA. Vehicle group n=5, Gly-MCA group n=6. Data are presented as mean±s.d. Two-tailed Student's t-test. (h) Ileum and liver Gly-MCA levels. Expression was normalized to 18S RNA. n=5 mice per group. Data are presented as mean±s.d. Two-tailed Student's t-test. *P<0.05, **P<0.01 compared with liver Gly-MCA levels. (i) Tissue Gly-MCA levels as area under the curve (AUC) at the indicated time points 24 h post Gly-MCA (10 mg kg−1) treatment. n=5 mice per group. Data are presented as mean±s.d. Two-tailed Student's t-test. **P<0.01 compared with liver Gly-MCA levels.

