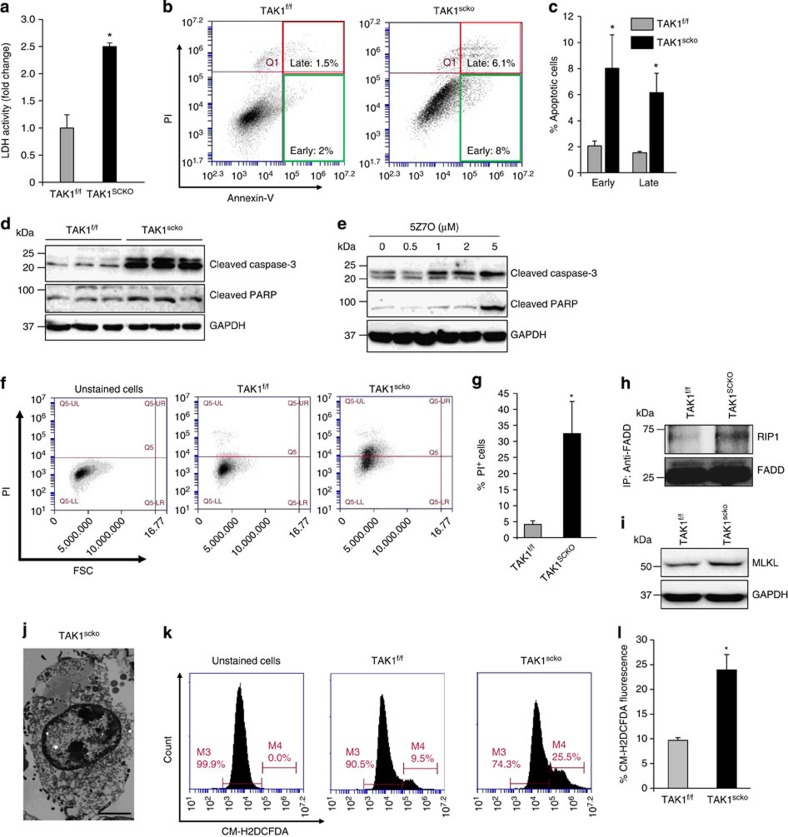
Figure 6. Inactivation of TAK1 induces cell death in satellite cell cultures.
Primary myogenic cultures were established from non-tamoxifen-treated TAK1f/f and TAK1scko mice and the cells were then treated with 4-hydoxytamoxifen (TAM) for 48 h to induce Cre-mediated recombination. After washing the cells, they were incubated in growth medium for another 72 h. (a) Relative amounts of lactate dehydrogenase (LDH) in supernatants of TAK1f/f and TAK1scko cultures. (b) The cells were collected and stained for Annexin V and propidium iodide (PI) and analysed by FACS to detect early and late apoptotic cells. Representative dot plots are presented here. (c) Quantification of early and late apoptotic cells in TAK1f/f and TAK1scko cultures after FACS analysis. (d) Immunoblots presented here demonstrate relative levels of cleaved caspase-3 and cleaved poly (ADP-ribose) polymerase (PARP) in TAK1f/f and TAK1scko cultures. (e) Primary myogenic cultures prepared from WT mice were treated with indicated concentrations of 5Z-7-oxozeaenol (5Z7O) for 24 h followed by performing western blotting for cleaved capsase-3, cleaved PARP and an unrelated protein GAPDH. Representative immunoblots from two independent experiments are presented here. (f) After the removal of TAM and culturing for 72 h, the TAK1f/f and TAK1scko cells were stained for PI and analysed by FACS to detect necroptosis. Representative dot plots of FACS analysis of unstained and PI+ cells in TAK1f/f and TAK1scko cultures are presented here. (g) Quantification of percentage of PI+ cells in TAK1f/f and TAK1scko cultures. (h) TAK1f/f and TAK1scko cells were immunoprecipitated with anti-FADD followed by immunoblotting to detect RIP1 and FADD protein. Immunoblots presented here demonstrate increased interaction of FADD with RIP1 in TAK1scko cultures. (i) Immunoblot presented here demonstrates levels of MLKL protein in TAK1f/f and TAK1scko cultures. (j) Representative image of transmission electron microscopy showing necroptosis in TAK1scko cell. Scale bar, 2 μm. (k) TAK1f/f and TAK1scko cells were incubated with CM-H2DCFDA dye for 20 min followed by analysis with FACS. (l) Quantification of cells stained positive with CM-H2DCFDA. N=3–4 in each group for all the experiments in this figure. Error bars represent s.d. *P<0.05 values significantly different from TAK1f/f cultures by unpaired t-test.

