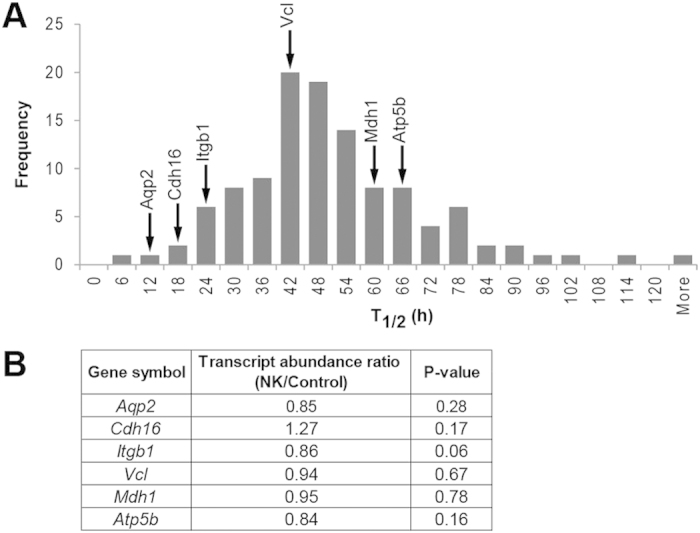
Figure 4. Estimated half-lives and transcript quantification of down-regulated proteins.

(A) A distribution of the estimated half-lives for the down-regulated proteins identified in this proteomic study (based on mouse collecting duct proteins27). The estimated half-lives of AQP2 and five representative proteins are indicated by arrows (A) and their transcript abundance ratios (NK/Control) as determined by qRT-PCR are shown (B).
