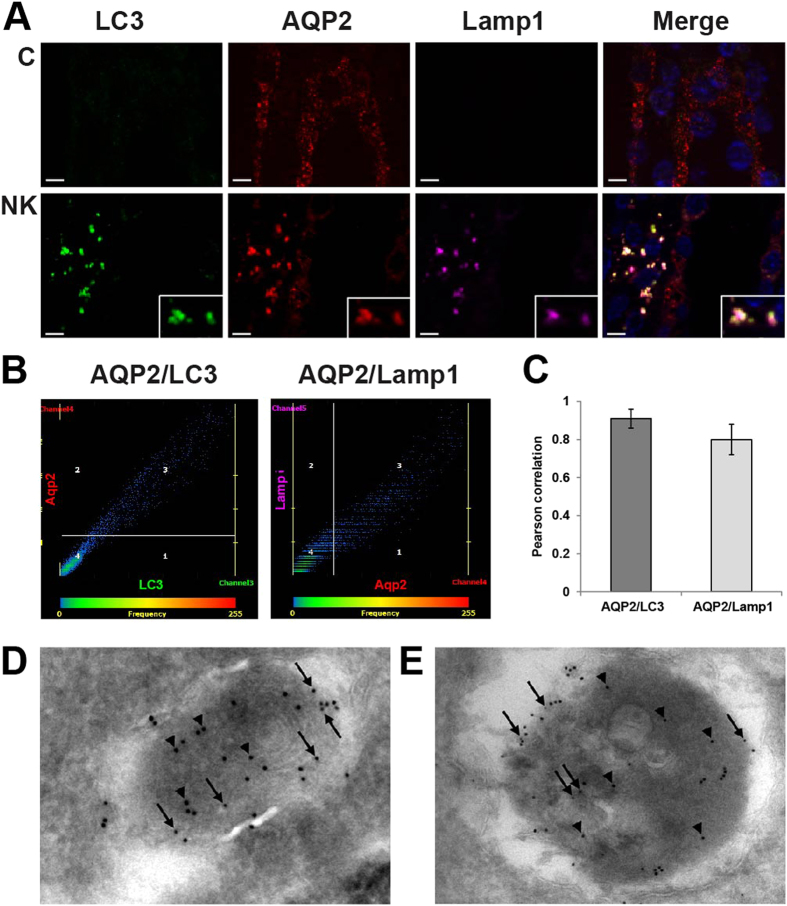
Figure 6. Co-localization of AQP2 with autophagy markers.
(A) The inner medulla sections of control rats (C) and rats fed with a potassium-free diet for 1 day (NK) were triple-labeled against AQP2 (red), Lamp1 (pink), and LC3 (green). Insets demonstrate significant co-localization as a group of puncta, which were not observed in control sections. Scale bar = 4 μm. (B) Representative scatter plots demonstrate the high degree of co-localization between AQP2 and LC3 (r2 = 0.83, P < 0.05) or Lamp1 (r2 = 0.73, P < 0.05) after potassium deprivation. (C) A bar graph summarizes Pearson correlation coefficients of AQP2 and LC3 or Lamp1. (D) By immunogold EM, AQP2 (small gold particles, arrows) and LC3β (large gold particles, arrow heads) localize in autophagosomes in IMCD cells of potassium-deprived rats. (E) AQP2 (small gold particles, arrows) and cathepsin-D (large gold particles, arrow heads) also localize in similar membrane-bound organelles.

