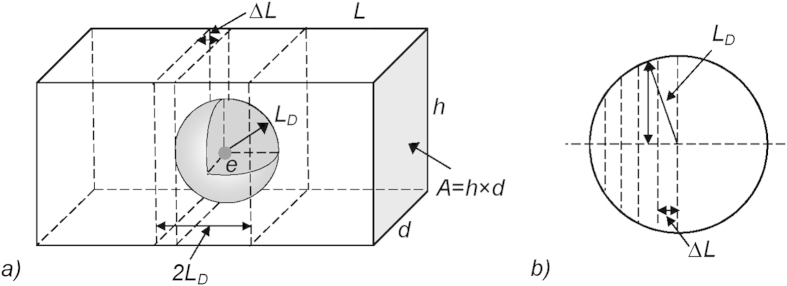
Figure 1. Schematic pattern for evaluation of the resistance fluctuation of the investigated sample (a) due to forming of the screened volume (Debye sphere (b)).
The value of the step ΔL has been chosen in such a way that volume of the bar within the length 2LD was equal to the sum of the volume of the Debye sphere and the volume of the rest part in the range 2LD without this sphere.

