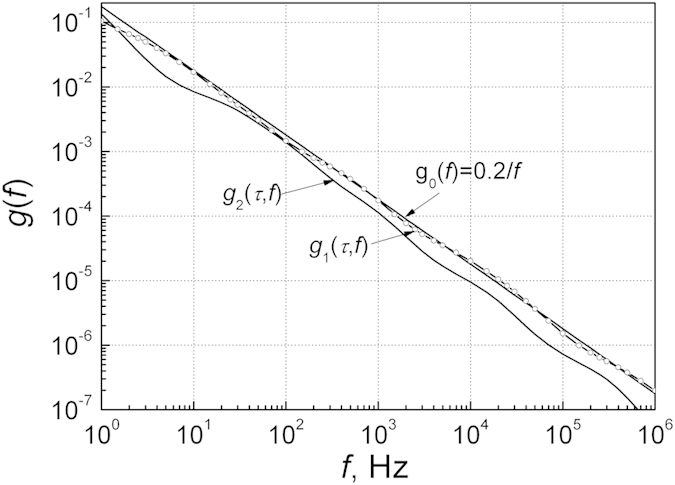
Figure 3. Modeled low frequency noise spectra with small number of widely distributed relaxation times τri.

Function g0(f) = 0.2/f (linear line in logarithmic scale) shows the 1/f noise spectrum when the relaxation times are distributed as  , i. e., one-by-one of the relaxation time in every two octaves; g1(τ, f) (line with open dots) is the noise spectrum when relaxation times are arbitrarily distributed one-by-one in the range of every two octaves; g2(τ, f) (solid line) is the noise spectrum when relaxation times are arbitrarily distributed one-by-one in the range of every decade.
