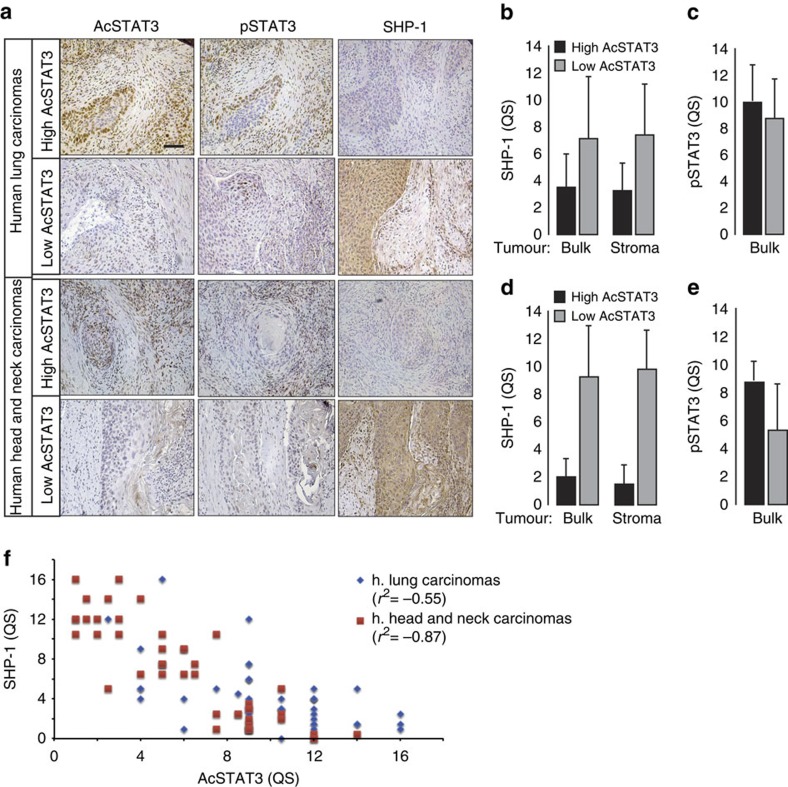
Figure 7. Inverse correlation of AcSTAT3 and SHP-1 expression.
(a) AcSTAT3, pSTAT3 and SHP-1 immunohistological staining in human head and neck (n=50) and lung (n=50) carcinomas. Scale bar, 100 μm. (b) Quantification of mean Quick Score (QS) for SHP-1, both in the stroma and the tumour bulk, in lung carcinomas decorated with high- and low-acetylated STAT3 shown in a. (c) Quantification of mean Quick Score (QS) for pSTAT3, in the tumour bulk, in lung carcinomas decorated with high and low acetylated STAT3 shown in a. (d) Quantification of mean QS for SHP-1, both in the stroma and the tumour bulk, in head and neck carcinomas decorated with high- and low-acetylated STAT3 tumours shown in a. (e) Quantification of mean Quick Score (QS) for pSTAT3, in the tumour bulk, in head and neck carcinomas decorated with high- and low-acetylated STAT3 shown in a. (f) Plot of mean QS form AcSTAT3 (x axis) and SHP-1 (y axis) showing a negative correlation between Acetylated STAT3 and SHP-1 detection in lung (blue) and head and neck (red) carcinomas.

