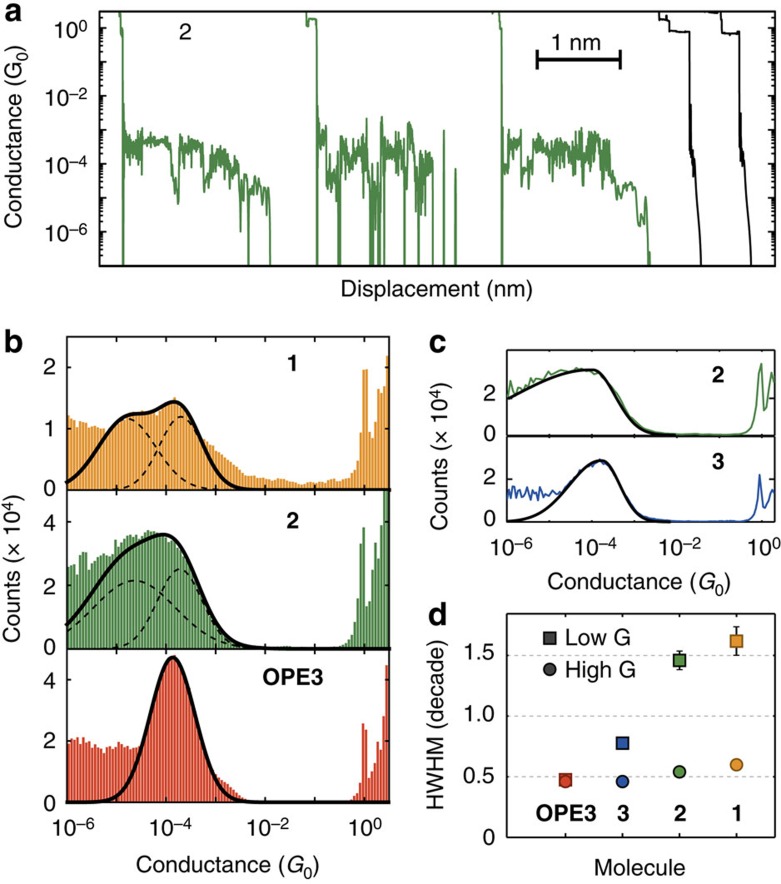
Figure 5. Single-molecule conductance results.
(a) Conductance traces measured in presence of 2 while separating the mechanically controlled break-junction (MCBJ) nanoelectrodes. The bias is 0.1 V and the electrodes are retracted at a speed of 5 nm s−1. (b) Conductance histograms of 1, 2 and OPE3 built from >1,000 traces each. The thick black lines represent the fit of the molecular peak to a sum of two Gaussian curves defined in equation (1) and the dashed lines represent the individual Gaussian peaks. (c) Conductance histograms of 2 and 3 built from >1,000 traces each. The black lines represent a fit to the two-piece Gaussian function defined in equation (2). (d) Half-width at half-maximum of the molecular conductance peaks on the higher conductance side of the peak (circles) and lower (squares) extracted from the two-piece Gaussian standard deviations. While the high-conductance values are close to 0.5 decades for all four molecules, the donor–acceptor molecules have a much larger width at the low-conductance side.

