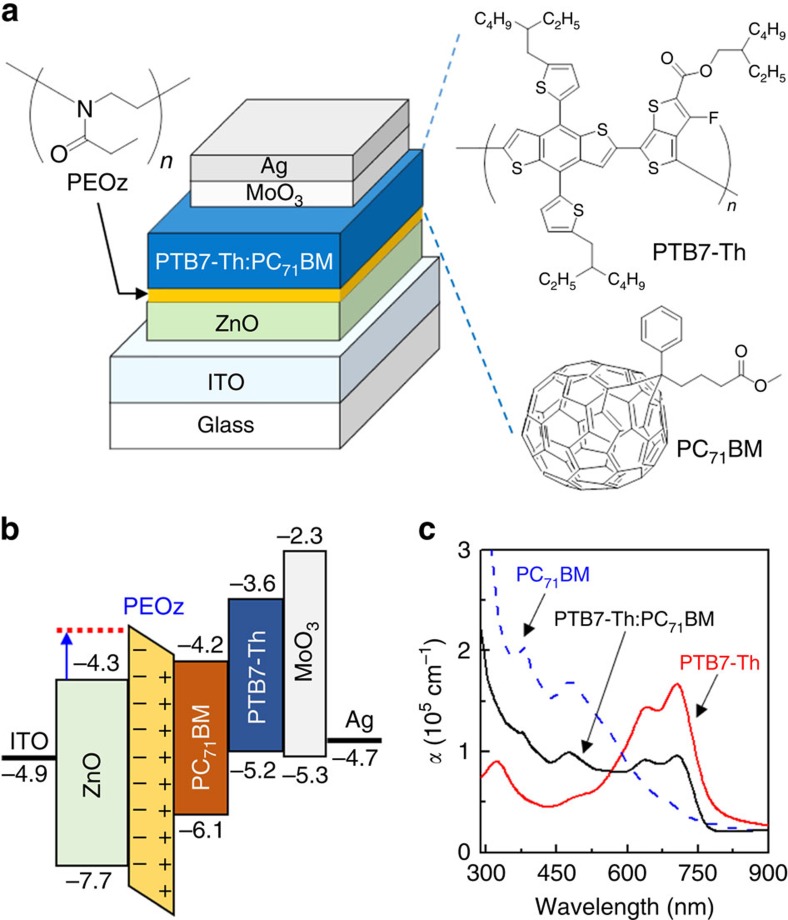
Figure 2. Device/energy band structure and absorption coefficient data.
(a) Solar cell device stack and chemical structures for PTB7-Th, PC71BM and PEOz. (b) Flat energy band diagram for the PTB7-Th:PC71BM BHJ solar cells with ZnO/PEOz ECBL/interlayer. The conduction band and valence band energy values of the ZnO layer were measured in this work (see the Methods section). The blue arrow denotes the shift in ZnO work function caused by the PEOz. (c) Absorption coefficient (α) spectra for pristine films of PTB7-Th and PC71BM, and for a BHJ PTB7-Th:PC71BM blend film.

