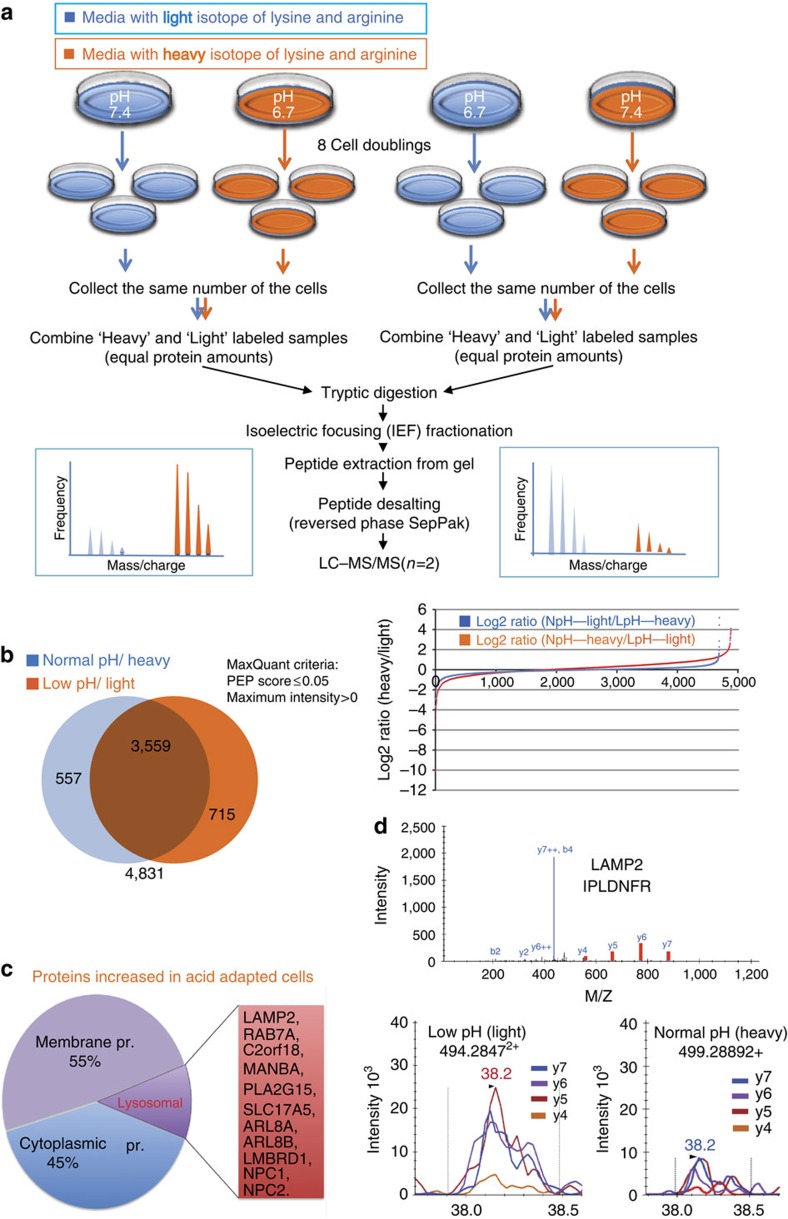
Figure 2. Shotgun SILAC-proteomics discovery approach.
(a) Schematic of stable isotope labelling with amino acid in cell culture for MS analysis (SILAC-MS/MS). Acid-adapted and naive MCF-7 cells were grown either in media of normal isotopic distribution or in heavy (Δ6-Lys, Δ 10-Arg) medium for eight doublings (1 week). The cells were collected and lysed and combined for equal protein loads between the two groups. A label-flipping approach was employed through a parallel experiment, allowing for confident quantification and reducing false-positive biomarker associations. (b) The Venn diagrams show the number of protein discovered in each flipping experiment. The number underneath the diagram is the total protein number. Orange is the number of proteins with heavy label and blue with the light label. The graph beside the Venn diagram is observed log2 peak area ratios for flipping experiments plotted on the same graph. Candidate biomarkers were selected among proteins showing at least a 1.5-fold increase in expression under acidic conditions in both replicates across flipping experiments. (c) A Pie chart of proteins with increased expression in acid-adapted cells. In all, 45% of the proteins are cytoplasmic and 55% membrane proteins of which 12.8% are lysosomal and endosome proteins. (d) LC-MRM validation of discovered low-pH-induced proteins. MS/MS spectra of peptides from LAMP2 shown here, was extracted from our shotgun data set and used for the development of targeted multiple reaction monitoring (MRM) assays (optimized transitions indicated in red). Bottom panel: relative quantification was accomplished by comparing peak areas using Skyline.

