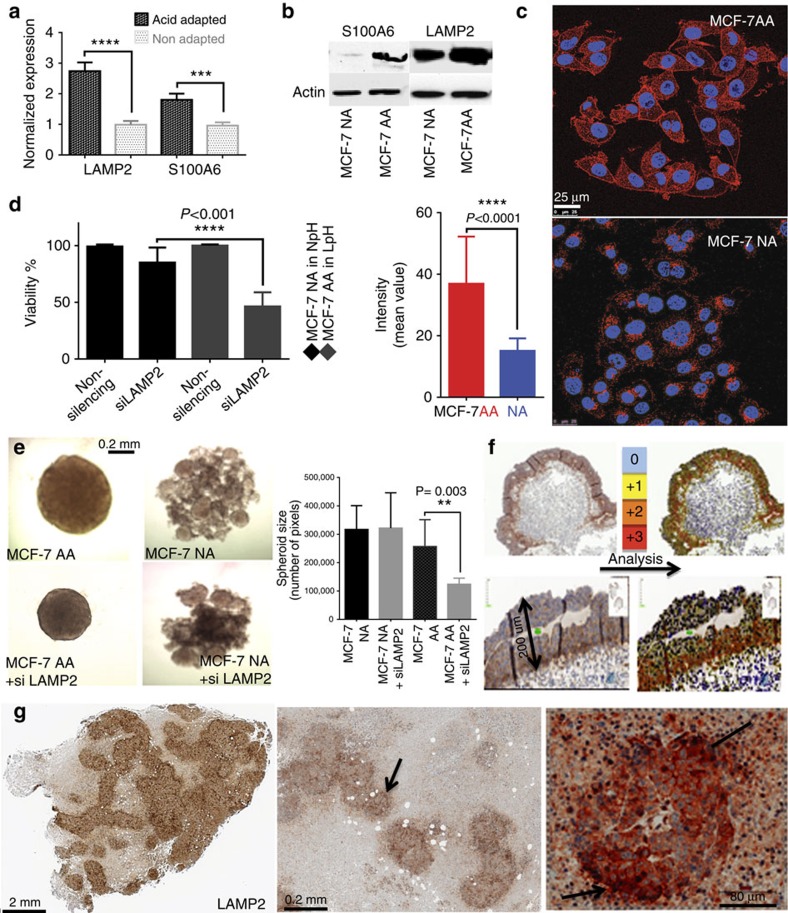
Figure 3. In vitro confirmation of proteomics results.
(a) Quantitative reverse transcription–PCR and (b) western blot and (c) ICC results confirmed the higher expression level of LAMP2 in AA cells relative to NA MCF-7 cells. (d) LAMP2 siRNA treatment of NA and AA MCF-7 cells decreased the viability of acid-adapted cells much more than non-adapted cells. (e) siRNA treatment of spheres of AA and NA MCF-7 cells revealed that growth and size of AA spheres are affected by LAMP2 expression. The graph shows the average pixel count of spheres from both groups with error bars as s.d. (f) Representative images of spheroid 3D culture model (Rotary system) of MCF-7 cells showing the increased expression of LAMP2 close to the central part of the tumours at the oxygen diffusion limit (∼200 μm). (g) Representative images of heterogeneous LAMP2 expression (black arrow in IHC analysis) indicate high expression of LAMP2 at the suspected acidic regions of mouse tumour xenografts, such as the necrotic area neighbourhood and invasive edges.

