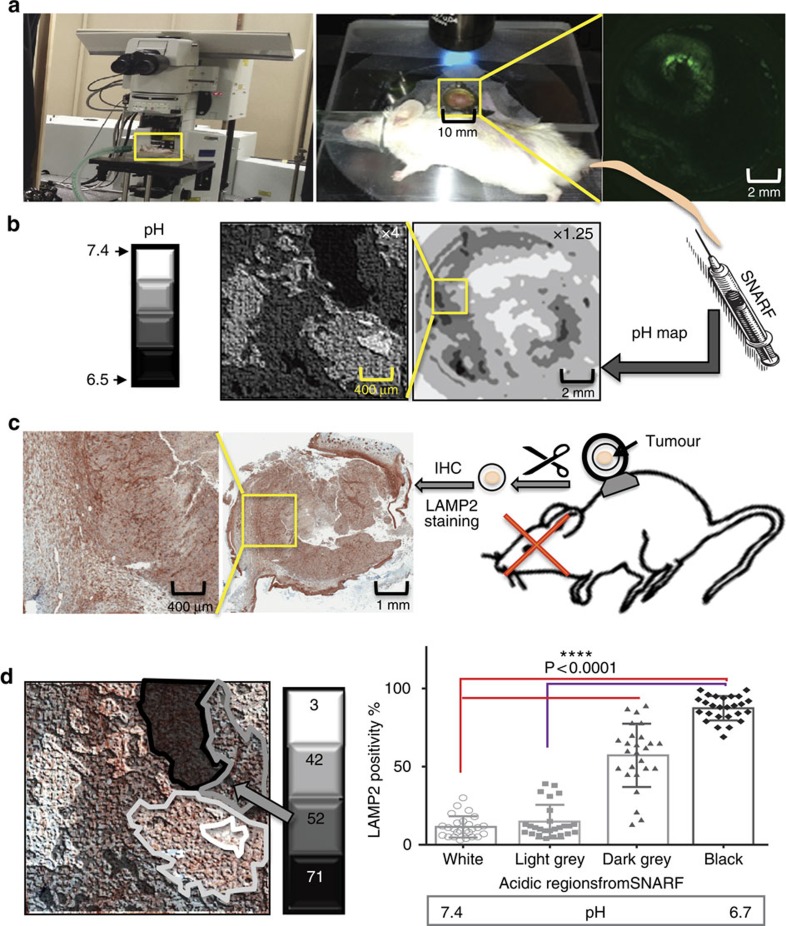
Figure 4. Correlation of marker expression with tumour pH using intravital imaging of SNARF-1 in DWC followed by IHC staining.
(a) Regional extracellular tumour pH was determined by intravital imaging of the pH-sensitive fluorescent dye, SNARF-1, in breast cancer DWC xenograft tumours using an olympus multiphoton microscope. (b) Representative pH maps generated by the SNARF-1 ratiometric analysis on day 16 post tumour inoculation. Acidity ranges from low pH (black) to normal pH (white), meaning black is the most acidic area and white the least. (c) After the final SNARF-1 imaging, the tumours were extracted and fixed in the same orientation they were imaged and IHC stained for LAMP2 expression. The two left panels represent images of marker IHC staining for LAMP2 in two magnifications. (d) IHC staining images superimposed over the corresponding pH map (white, light grey, dark grey and black) to correlate the acidity of each region to expression of LAMP2 in the corresponding area. The stained tumours in each mapped region for acidity were analysed using positive pixel analysis by our custom-trained software in Definiene. The number in each box represents the percentage of cells that are LAMP2 positive. The correlation analysis showed significantly higher expression of LAMP2 in acidic areas of the tumours compared with non-acidic regions (Student's t-test, P<0.001 and error bars represent s.d.).

