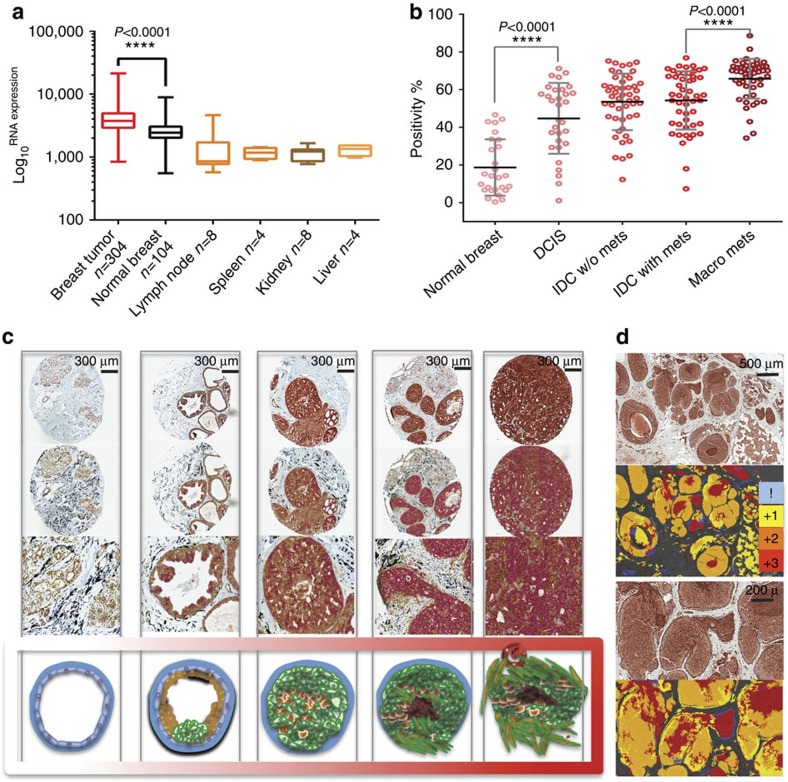
Figure 6. Translational study for LAMP2 expression in breast cancer samples.
(a) Microarray mRNA expression profile of LAMP2 in breast cancer tumours and normal tissue samples. Data are represented as mean+s.d. Note the log10 scale of RNA expression. (b) Percent positivity of LAMP2 IHC staining of cores from the breast cancer patient samples TMA containing 201 biopsy cores. A consecutive raise in LAMP2-positive staining pattern was observed with the progress of breast tumours from DCIS to invasive ductal carcinoma with metastasis. (c) Representative images of analysed TMA cores from each stage with the corresponding illustration from the schematic model of breast cancer progression at the bottom. (d) Overexpression of LAMP2 in acidic regions of breast cancer tumours. IHC staining of a DCIS with LAMP2 antibody showed overexpression of this protein in regions expected to be more acidic such as centres of DCIS or DCIS with microinvasion. Underneath each IHC panel is a colour-coded picture of the IHC section based on LAMP2 positivity (0–3) for better understanding.

